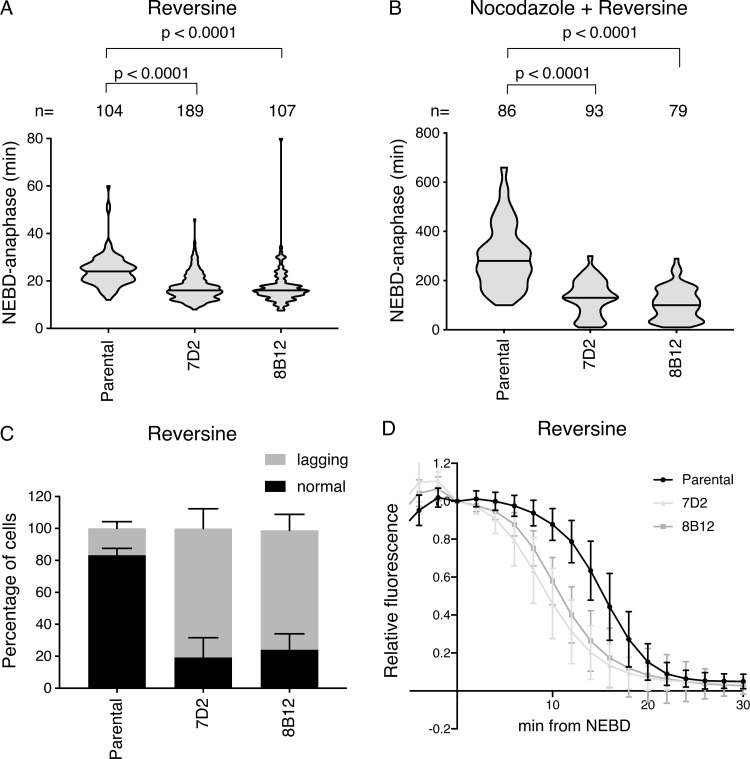
Figure 4.
Cells with mutant MAD1 mutant that cannot bind cyclin B1 are sensitive to partial MPS1 inhibition. (A and B) The timing from NEBD to anaphase was measured in parental RPE cyclin B1-Venus+/−:Ruby-MAD2+/− cells and in the MAD1 E53/E56K clones 7D2 and 8B12 by time-lapse DIC microscopy. Cells were treated with 166 nM reversine (A) or with 55 nM nocodazole plus 166 nM reversine (B) and the data plotted as in Fig. 3. Median values are shown as a black line, n indicates the number of cells analyzed, and the two-tailed P values were calculated using an unpaired Mann–Whitney t test. Data from at least three independent experiments are shown. (A) Parental n = 104 cells, clone 7D2 n = 189 cells, clone 8B12 n = 107 cells. (B) Parental n = 86 cells, clone 7D2 n = 93 cells, clone 8B12 n = 79 cells. (C) Quantification of lagging chromosomes in 166 nM reversine-treated parental RPE cyclin B1-Venus+/−, Ruby-MAD2+/− MAD1 wild type (wt) and the MAD1 E53/E56K 7D2 and 8B12 clones stained with SiR-DNA (see Videos 4 and 5). Error bars show SD. Parental n = 110 cells, clone 7D2 n = 182, clone 8D2 n = 108. (D) Cyclin B1-Venus degradation curves from parental RPE cyclin B1-Venus+/−:Ruby-MAD2+/− cells and from the MAD1 E53/E56K clones 7D2 and 8B12 treated with 166 nM reversine. Cyclin B1-Venus fluorescence levels were normalized to the value at NEBD and the mean values from >20 cells analyzed per experiment plotted, with the bars showing the SD. Data are representative of three experiments.

