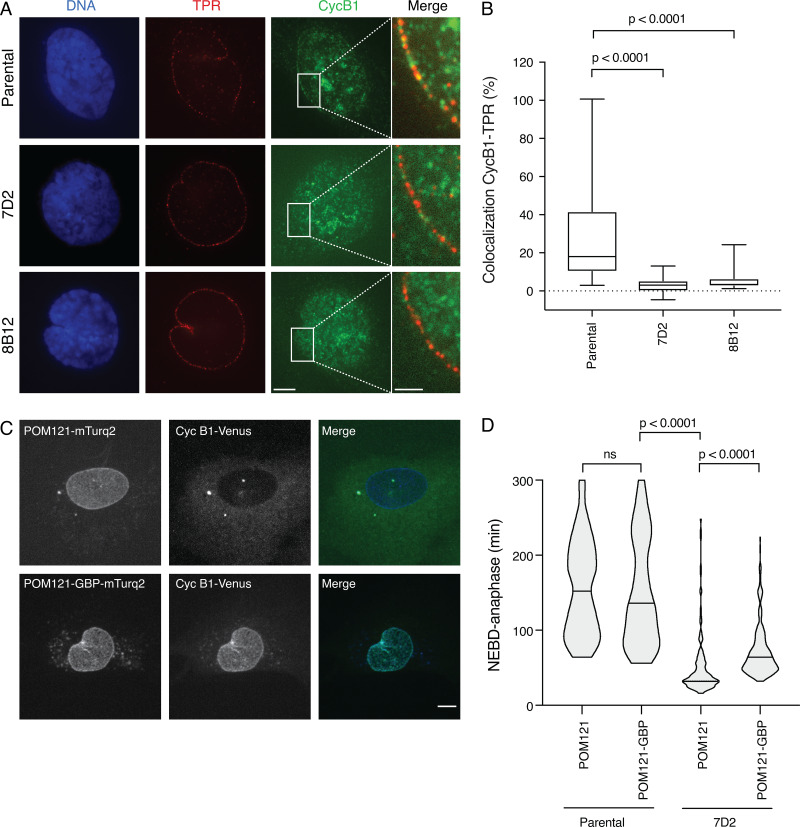
Figure 7.
Cyclin B1 colocalizes with TPR at the nuclear membrane during mitotic entry, and targeting it to the NPC partially restores the SAC. (A) Representative immunofluorescence images of parental RPE cyclin B1-Venus+/−:Ruby-MAD2+/−; RFP670-MIS12+/+ and MAD1 E53/E56K 7D2 and 8B12 clones fixed and stained for TPR, cyclin B1, and DNA just before NEBD. Scale bar, 5 µm for labeled panels. Right: Merged images of TPR and cyclin B1 in the area highlighted by the white rectangle. Scale bar, 2 µm. (B) Quantification of the colocalization between TPR and cyclin B1. Box plots show the mean and quartile values; whiskers show the maximum and minimum values. The results are calculated from at least two independent experiments (parental RPE clone, n = 34 cells; 7D2 clone, n = 24 cells; 8B12 clone, n = 24 cells). (C) Maximum projection images of parental RPE cyclin B1-Venus+/−:Ruby-MAD2+/−:RFP670-MIS12+/+ cells expressing either POM121-mTurq2 (top panels) or POM121-GBP-mTurq2 (bottom panels). Left: Localization of POM121-mTurq2 or POM121-GBP-mTurq2 at the NPC; middle: cyclin B1-Venus; right: the merged images. Scale bar, 5 µm. (D) The duration of mitotic arrest in 166 nM reversine + 100 nM paclitaxel for parental RPE cyclin B1-Venus+/−:Ruby-MAD2+/− cells and the MAD1 E53/E56K clone 7D2 expressing POM121-mTurq2 or POM121-GBP-mTurq2 was assayed by time-lapse microscopy and the data plotted using Prism software. The two-tailed P values were calculated using a Mann–Whitney unpaired t test. For the POM121-GBP-mTurq2-expressing cells, only those cells where cyclin B1-Venus was clearly recruited to the nuclear envelope were analyzed. See Videos 8 and 9.

