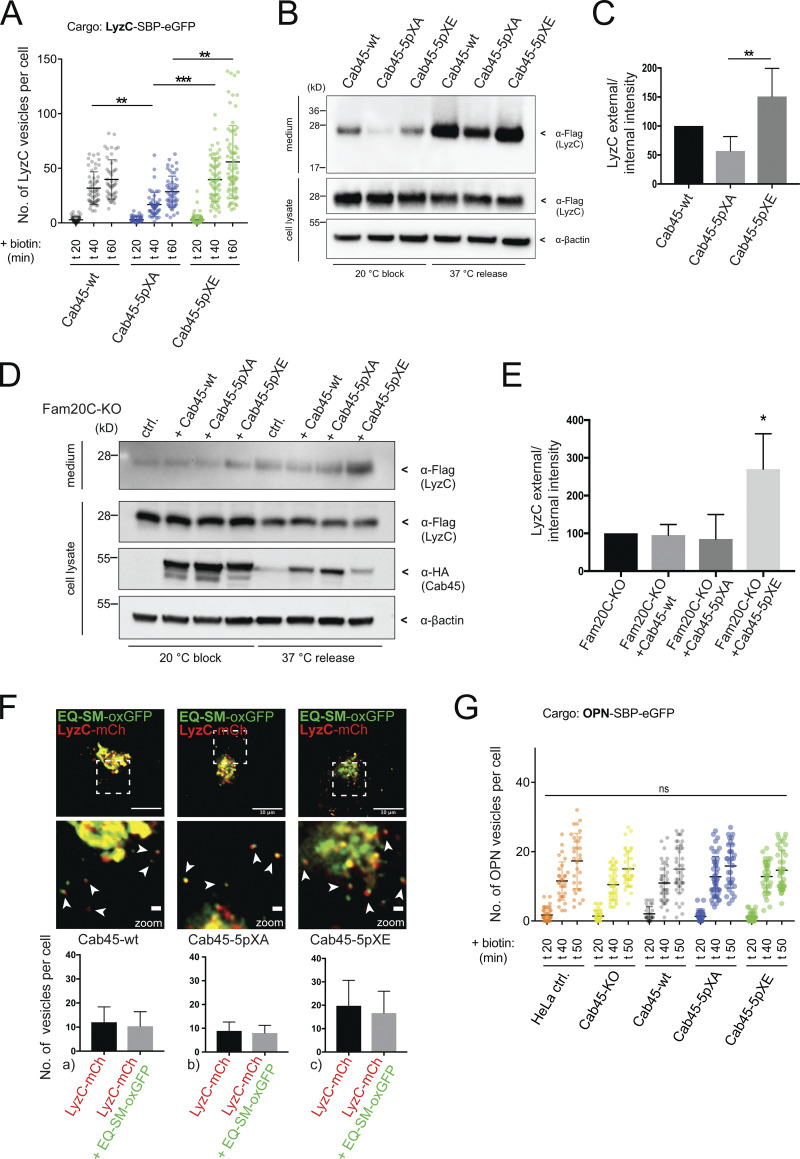
Figure 5.
Fam20C-dependent Cab45 phosphorylation drives client sorting and secretion. (A) LyzC vesicle formation was quantified from LyzC-RUSH experiments by analyzing z-stack images (d = 0.35 µm). Cell lines were fixed at 0, 20, 40, and 60 min after biotin addition. A scatter dot plot represents the means ± SD of at least three independent experiments (n > 45 cells per condition). Statistical test, Kruskal–Wallis. (B) Western blot analysis of the secretion of LyzC-Flag in Cab45-WT and phosphomutant cells after 20°C block and 37°C release. β-Actin was used as loading control. (C) Western blots of four independent experiments (B) were quantified by densitometry using ImageJ. The bar graph represents the means (± SD) of densitometric values of external LyzC-Flag, normalized to the internal levels in percentage. Statistical test, Kruskal–Wallis. (D) Western blot analysis of the secretion of LyzC-Flag in Fam20C-KO cells rescued with Cab45 and phosphomutants after 20°C block and 37°C release. β-Actin was used as loading control. (E) Western blots of three independent experiments (D) were quantified by densitometry using ImageJ. The bar graph represents the means ± SD of densitometric values of external LyzC-Flag, normalized to the internal levels in percentage. Statistical test, ordinary one-way ANOVA. (F) Sorting of LyzC in EQ-SM-vesicles was controlled by performing live-cell experiments acquiring time-lapse movies. Example micrographs depict the Golgi of Cab45-WT and phosphomutants that expressed LyzC-mCherry and EQ-SM-oxGFP. Scale bars, 10 µm; magnification scale bars, 1 µm. Arrowheads indicate secretory vesicles containing both fluorescence proteins. The means ± SD of post-Golgi LyzC vesicles per cell positive for EQ-SM were quantified (n = 8 cells per condition). (G) OPN vesicle formation was quantified from OPN-RUSH experiments by analyzing z-stack images (d = 0.35 µm). Cell lines were fixed at 0, 20, 40, and 50 min after biotin addition. A scatter dot plot represents the means ± SD of at least three independent experiments (n > 28 cells per condition). Statistical test, Kruskal–Wallis. *, P < 0.05; **, P < 0.01; ***, P < 0.001.

