Figure 6.
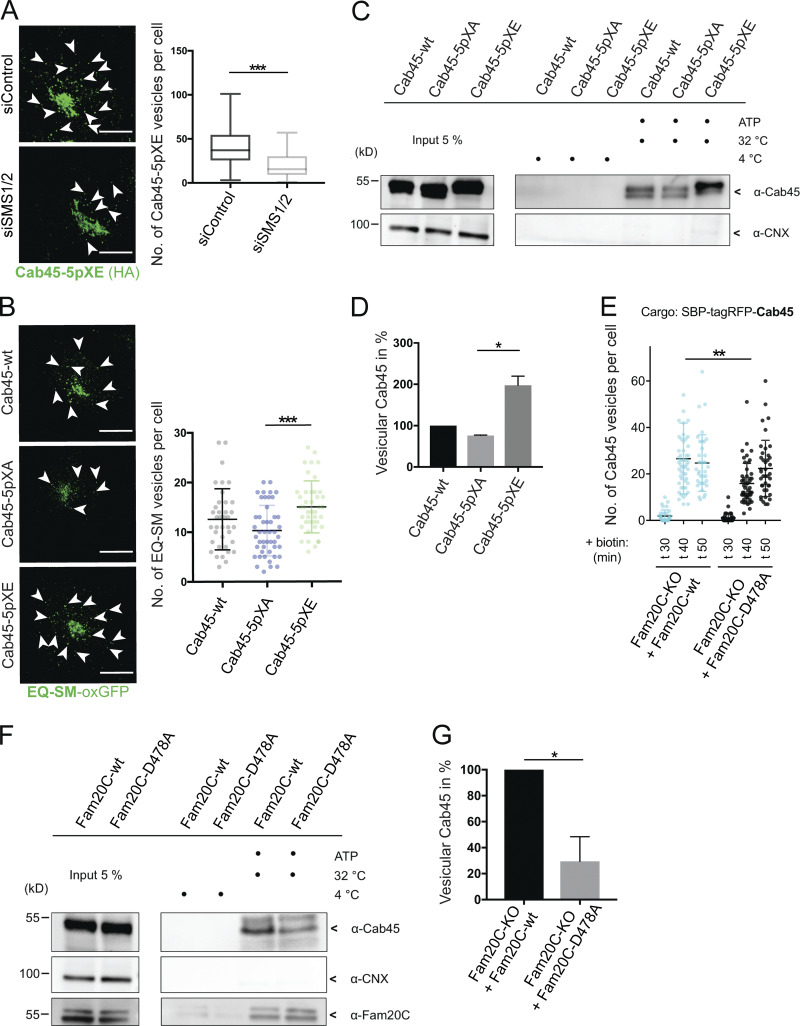
Mimicking Cab45 phosphorylation results in accelerated TGN export. (A) Representative immunofluorescence pictures of cells that stably expressed Cab45-5pXE, treated with control or SMS1/2 siRNA. Cells were stained against Cab45 (α-HA), and numbers of vesicles were quantified from z-stack images (d = 0.35 µm). Arrowheads indicate post-Golgi vesicles. Scale bars, 10 µm. Box and whiskers blot represents means with minimum to maximum values of at least three independent experiments (n > 57 cells per condition). Statistical test, Mann–Whitney. (B) Example micrographs of Cab45-WT and phosphomutant cell lines transfected with EQ-SM-oxGFP, after 20°C block and 37°C release. EQ-SM-oxGFP vesicles were quantified from z-stack images (d = 0.35 µm). Scale bars, 10 µm. A scatter dot plot represents means ± SD of at least three independent experiments (n > 37 cells per condition). Statistical test, Kruskal–Wallis. (C) Vesicular budding assay of Cab45 phosphomutants. TGN vesicle budding was initiated by an ATP regeneration system. Released vesicles were analyzed by Western blotting for Cab45 and CNX. (D) Western blots of three independent experiments (C) were quantified by densitometry with ImageJ. The bar graph represents the means ± SD of densitometric values of vesicular Cab45 in percentage. Statistical test, Kruskal–Wallis. (E) Cab45 vesicle formation was quantified from Cab45-RUSH experiments by analyzing z-stack images (d = 0.35 µm). Fam20C-KO cells expressing Fam20C-WT or Fam20C-D478A were fixed at 0, 30, 40, and 50 min after biotin addition. A scatter dot plot represents the means ± SD of at least three independent experiments (n > 35 cells per condition). Statistical test, Kruskal–Wallis. (F) Vesicular budding assay of endogenous Cab45. TGN vesicle budding was initiated by an ATP regeneration system in Fam20C-KO cells, which were transfected with Fam20C-WT and D478. Released vesicles were analyzed by Western blotting for Cab45, Fam20C (HA), and CNX. (G) Western blots of four independent experiments (F) were quantified by densitometry with ImageJ. The bar graph represents the means ± SD of densitometric values of vesicular Cab45 in percentage. Statistical test, Welch’s unpaired t test. *, P < 0.05; **, P < 0.01; ***, P < 0.001.

