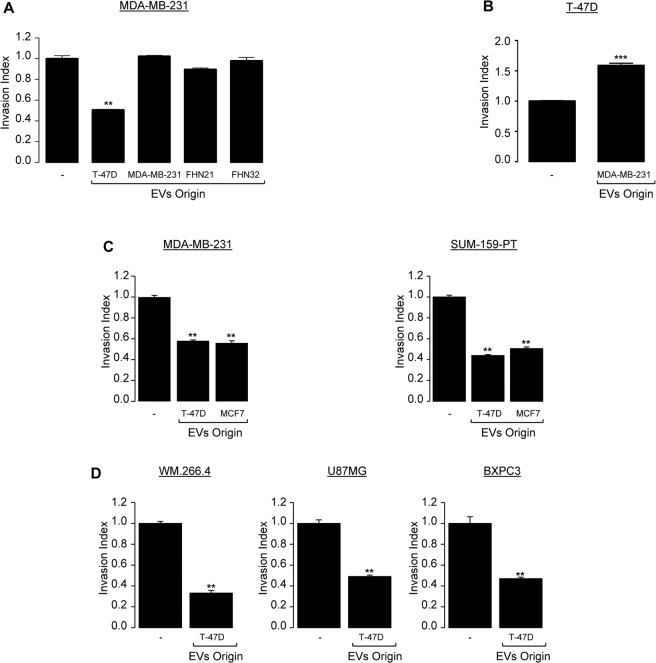
Figure 1.
EVs produced by poorly aggressive luminal breast cancer cells exert anti-invasive properties in vitro on different types of cancer cells. (A) Highly invasive triple negative breast cancer cells MDA-MB-231 were serum starved for 24 h and left untreated or were treated the following day with 3 × 10⁸ pp/mL EVs isolated from by WT T-47D; from WT MDA-MB-231 or from 2 different female primary human dermal fibroblasts (FHN21, FHN32) and subjected to in vitro invasion assay for 6 h. Data from one representative experiment of two independent experiments is shown, all data are shown as mean ± SEM (n = 3 technical replicates; **p < 0.005). (B) Poorly invasive luminal breast cancer cells T-47D were serum starved for 24 h and left untreated or were treated the following day with 3 × 10⁸ pp/mL EVs produced by WT MDA-MB-231 subjected to in vitro invasion assay for 24 h. Data from one representative experiment of two independent experiments is shown, all data are shown as mean ± SEM (n = 3 technical replicates; ***p < 0.001, compared to the untreated cells). (C) Highly invasive triple negative breast cancer cells MDA-MB-231 (left panel) and SUM-159-PT (right panel) were serum starved for 24 h and left untreated or treated the following day with 3 × 10⁸ pp/mL EVs produced by WT T-47D or by WT MCF7 and subjected to an in vitro invasion assay for 6 h. Data from one representative experiment of two independent experiments is shown, all data are shown as mean ± SEM (n = 3 technical replicates; **p < 0.005, compared to the untreated cells). (D) Highly invasive melanoma (WM.266.4), glioblastoma (U87MG) and pancreatic cancer cells (BXPC3) were serum starved for 24 h and left untreated or were treated the following day with 3 × 10⁸ pp/mL EVs produced by WT T-47D and subjected to in vitro invasion assay for 6 h. Data from one representative experiment of two independent experiments is shown, all data are shown as mean ± SEM (n = 3 technical replicates; **p < 0.005, compared to the untreated cells). For all data, the invasion index is calculated as a proportion of the number of invasive cells in treated wells compared to the number of invasive cells in the control well (−) arbitrarily set to 1.

