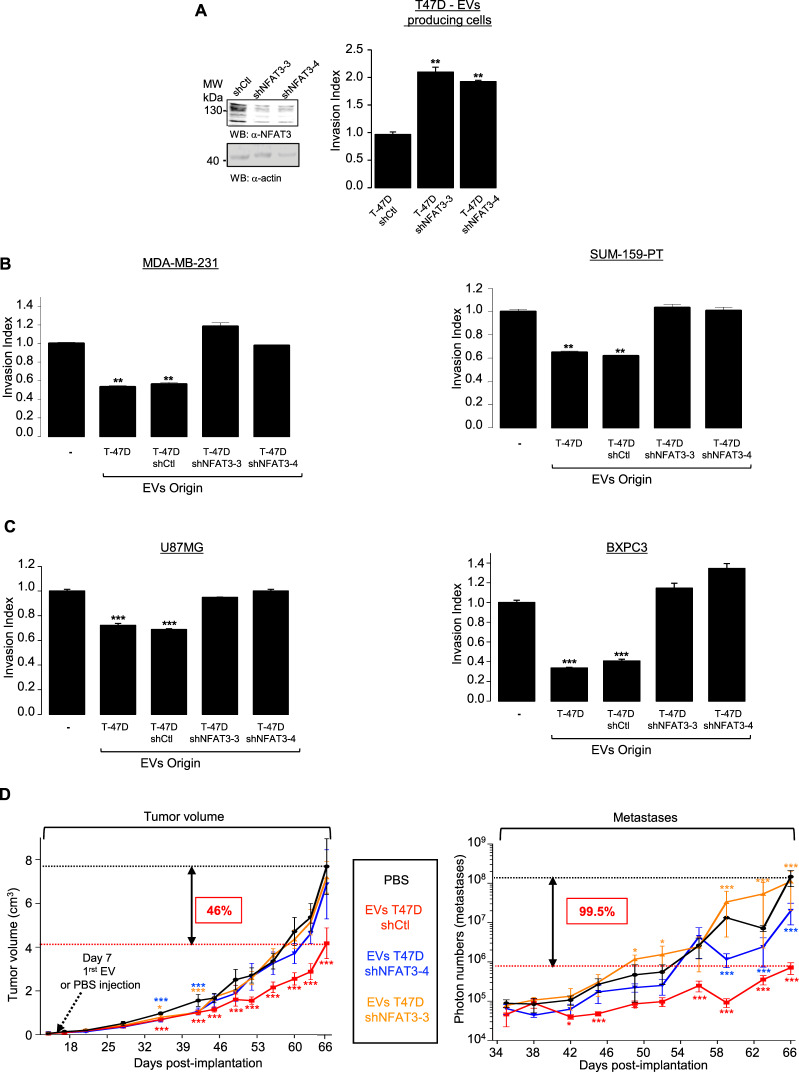
Figure 2.
NFAT3 expression in EVs-producing cells is required to confer anti-invasive capacity in vitro and anti-tumoral and anti-metastatic functions to EVs in vivo. (A) Satble clones expressing either a shRNA control (T-47D shCtrl) or two independents NFAT3 shRNA (T-47D shNFAT3-3, T-47D shNFAT3-4). Left panel: Whole cell lysates were revealed by an anti-NFAT3 (α-NFAT3) and normalization was done by revelation with an anti-actin (α-actin) on the same blot after cutting the membrane. Right panel: T-47D shCtrl, shNFAT3-3 or shNFAT3-4 were serum starved for 24 h and the following day subjected to an in vitro invasion assay for 24 h. Data from one representative experiment of three independent experiments is shown, all data are shown as mean ± SEM (n = 3 technical replicates; **p < 0.005, compared to the untreated cells). (B) Highly invasive MDA-MB-231 or SUM-159-PT cells were serum starved and pre-treated or not with 3 × 10⁸ pp/mL EVs produced by WT T-47D (T-47D) or T-47D shCtrl, T-47D shNFAT3-3, T-47D shNFAT3-4 and tested for their invasion for 6 h. Data from one representative experiment of three independent experiments is shown, all data are shown as mean ± SEM (n = 3 technical replicates; **p < 0.005, compared to the untreated cells). (C) Glioblastoma U87MG cells or pancreatic cancer cells BXPC3 were treated as described above and tested for their invasion for 6 h. Data from one representative experiment of three independent experiments is shown, all data are shown as mean ± SEM (n = 3 technical replicates; **p < 0.005, ***p < 0.001, compared to the untreated cells). For all data, the invasion index is calculated as a proportion of the number of invasive cells in treated conditions compared to the number of invasive cells in the control condition (−) arbitrarily set to 1. (D) 5 × 10⁵ MDA-MB-231 cells (D3H2LN-LUC) were injected into the left Fat Pad of each 6-weeks-old female mouse Athymic Nude mice. Tumor volume: Tumor growth is presented as the mean tumor volume (cm3) ±SEM, from mice injected weekly intra tumor with PBS or with EVs T-47D shCtl (5 × 10⁹ pp) or EVs T-47D shNFAT3-3, EVs T-47D shNFAT3-4, 7 days after cell xenotransplantation, 8 mice per groups. Metastases: Beginning day 35, weekly, bioluminescent images were acquired on the IVIS system to quantify the mean of photons flux produced by the metastatic cells. Metastases quantification is presented as the mean photon flux produced by the metastatic cells. Data from one representative experiment of two independent experiments is shown, all data are shown as mean ± SEM (n = 8 technical replicates;, *p < 0.05 **p < 0.005 and ***p < 0.001, compared to the PBS treated mice group).

