Figure 3.
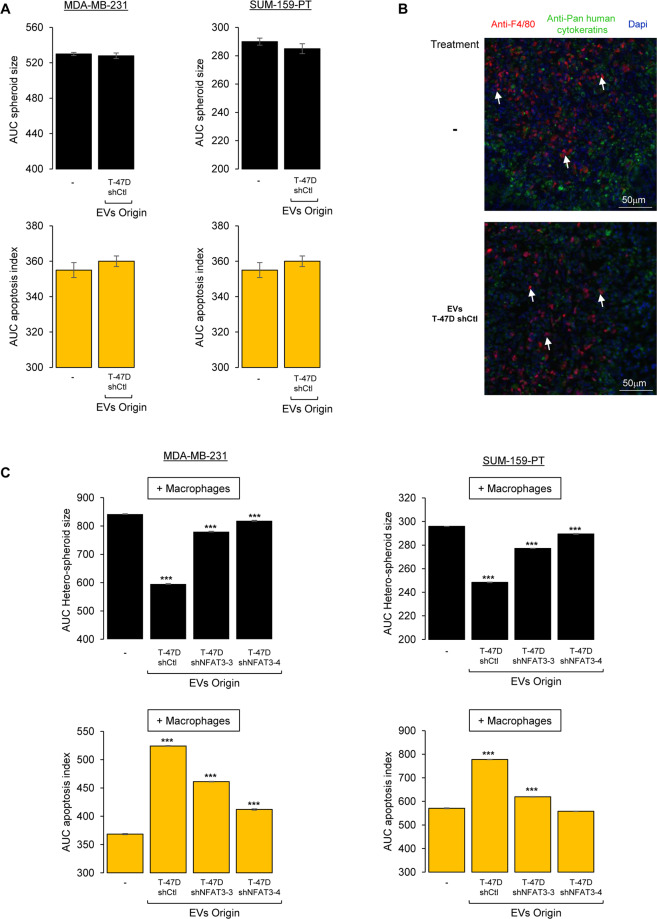
EVs from NFAT3-expressing cells inhibit cell growth and increase apoptosis in cancer cells in cooperation with macrophages. (A) MDA-MB-231 cells (left panel) and SUM-159-PT cells (right panel) were plated in medium with 3% Matrigel in 96-well ultra low attachment plates for three days to allow the formation of the spheroids formed. Medium was then added to each condition containing the apoptosis indicator (fluorescent caspase 3/7 substrate) supplemented with medium and containing or not the different EVs (3 × 10⁸ pp/mL) as indicated. Size of the spheroids and appearance of green fluorescence (apoptosis) was recorded every 2 h on an INCUCYTE device for 4 days. Data are represented as the AUC of the spheroid size (upper panels) and apoptosis (lower panels) over 96 h. Data from one representative experiment of three independent experiments is shown, all data are shown as mean ± SEM (n = 3 technical replicates). (B) Frozen tumor tissues sections of mice xenografted with MDA-MB-231 cells (D3H2LN-LUC) and treated with PBS (−) or EVs T-47D shCtl were co-labelled with Dapi and specific antibodies to mouse macrophages (anti-F4/80 antibody) and to detect the tumor cells with an anti-Pan human cytokeratin (arrows indicate infiltrating mouse macrophages). (C) Hetero-spheroids containing 33% of the murine macrophage cell line RAW 264.7 with either MDA-MB-231 or SUM-159PT were plated in medium with 3% Matrigel in 96 wells ultra low attachment plates for three days to allow the formation of the hetero-spheroids formed. Then medium was added to each condition containing the apoptosis indicator (fluorescent caspase 3/7 substrate) supplemented with medium containing or not the different EVs (3 × 10⁸ pp/mL) as indicated in the figure. The size of the spheroids and appearance of green fluorescence (apoptosis) were recorded every 2 h on an INCUCYTE apparatus for 4 days. Data are represented as the AUC of the spheroid size (upper panels) and apoptosis (lower panels) over 96 h. Data from one representative experiment of three independent experiments is shown, all data are shown as mean ± SEM (n = 3 technical replicates; ***p < 0.001, compared to the untreated cells).

