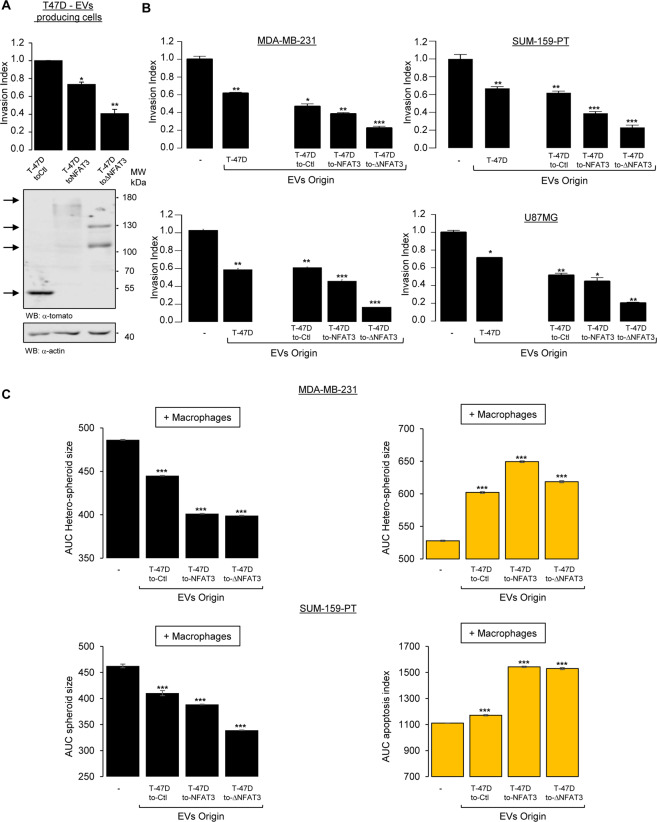
Figure 4.
The anti-invasive function of EVs in vitro can be further enhanced by overexpressing NFAT3 in T-47D EV-producing cells. (A) Stable clones of the T-47D cell line were generated expressing lentiviral constructs encoding either the control vector with a Tomato tag (T-47D toCtl) or the wild type NFAT3 (T-47D toNFAT3) or the active N-terminal deletion mutant of NFAT3 fused to the Tomato tag (T-47D toΔNFAT3). Lower panel: Western blot of T-47D cells stable clones. Whole cell lysates were revealed by an anti-tomato (α-tomato) and normalized by revelation with an anti-actin (α-actin) after stripping on the same blot. Upper panel: T-47D toCtl, T-47D toNFAT3 and T-47D toΔNFAT3 stable clones were serum starved for 24 h and the following day subjected to an in vitro invasion assay for 24 h. Data from one representative experiment of two independent experiments is shown, all data are shown as mean ± SEM (n = 3 technical replicates; *p < 0.05, **p < 0.005, compared to the untreated cells). (B) Highly invasive MDA-MB-231, SUM-159-PT, BXPC3 and U87MG cells were serum starved and pre-treated or not with 3 × 10⁸ pp/mL EVs produced by WT T-47D or by T-47D toNFAT3, T-47D toΔNFAT3 and T-47D toCtl and tested for their invasive capacity for 6 h. Data from one representative experiment of two independent experiments is shown, all data are shown as mean ± SEM (n = 3 technical replicates; **p < 0.005, p < 0.001, compared to the untreated cells). For all data, the invasion index is calculated as a proportion of the number of invasive cells in treated wells compared to the number of invasive cells in the control well (−) arbitrarily set to 1. (C) Hetero-spheroids containing 33% of the murine macrophage cell line RAW 264.7 with either MDA-MB-231 or SUM-159PT were plated in medium with 3% Matrigel in 96 wells ultra low attachment plates for 3 days to allow the formation of the hetero-spheroids. Medium was then added to each condition containing the apoptosis indicator (fluorescent caspase 3/7 substrate) with medium containing or not the different EVs (3 × 10⁸ pp/mL). The size of the spheroids and green fluorescence (apoptosis) was recorded every 2 h on an INCUCYTE apparatus for 4 days. Data are represented as the AUC of the spheroid size (upper panels) and apoptosis (lower panels) over 96 h. Data from one representative experiment of three independent experiments is shown, all data are shown as mean ± SEM (n = 3 technical replicates; ***p < 0.001, compared to the untreated cells).

