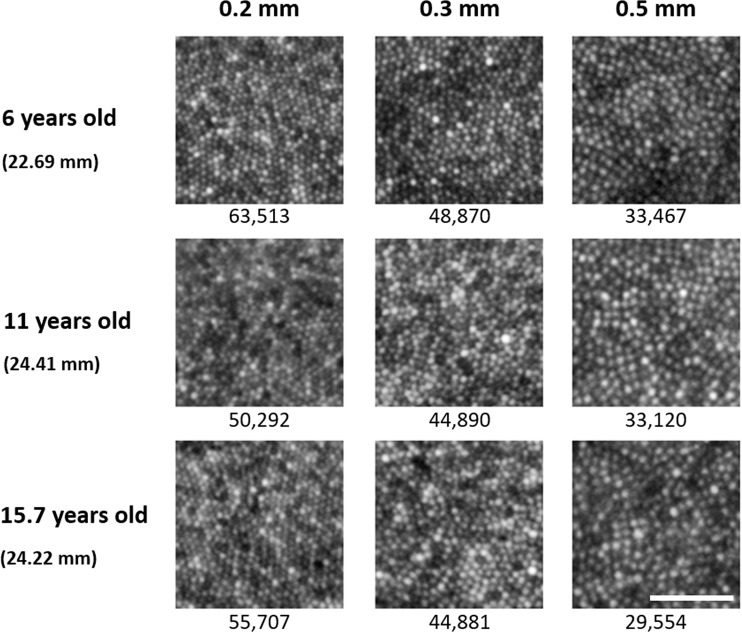
Figure 1.
Representative cone photoreceptor images acquired along the inferior meridian in three subjects at the three examined eccentricities of 0.2 mm, 0.3 mm, and 0.5 mm from the estimated location of peak cone density. Each subject’s axial length is indicated in parentheses beneath their age. Linear cone density (cones/mm2) is specified for each image. Linear cone photoreceptor density decreases with increasing eccentricity in each eye. Scale bar = 50 μm.

