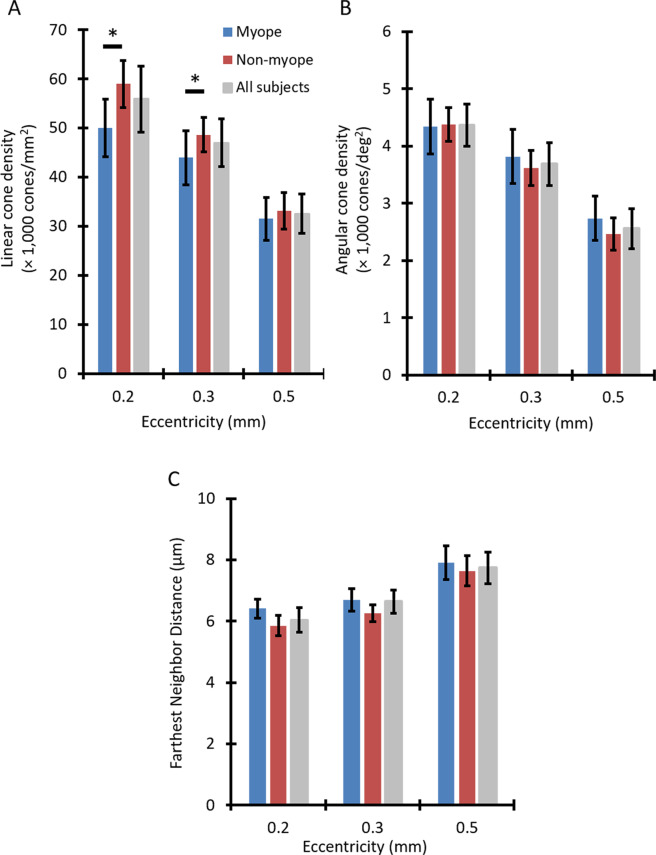
Figure 4.
Differences in cone density and spacing metrics were found between myopic and non-myopic groups. Mean (A) linear cone density, (B) angular cone density, and (C) farthest neighbor distance averaged across 10 myopic children (blue), 19 non-myopic children (red), and all 29 children combined (gray) as a function of eccentricity. Error bars represent ±1 standard deviation. Asterisks indicate a statistically significant difference between myopic and non-myopic groups at a given retinal eccentricity (P < 0.001). (A) Linear cone density was significantly lower in myopic children at 0.2 and 0.3 mm eccentricities. (B) Angular cone density was significantly higher across all eccentricities combined in myopic children. (C) Farthest neighbor distance was also significantly higher across all eccentricities combined in myopic children.

