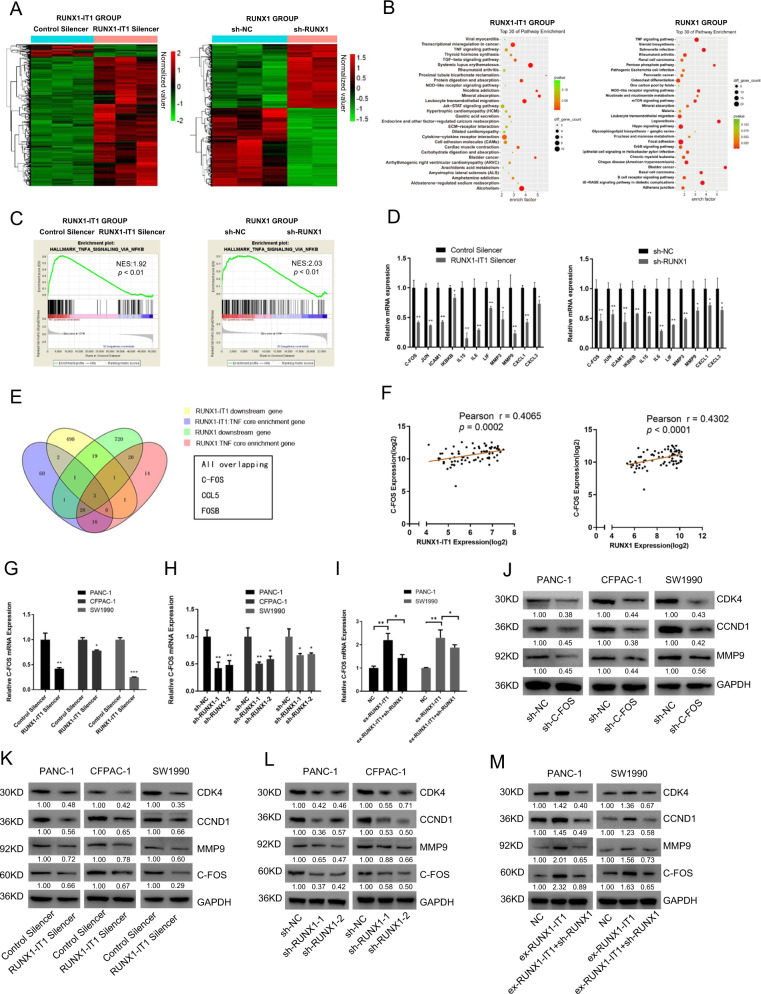
Fig. 5. C-FOS is a critical downstream target of RUNX1-IT1 and RUNX1.
a Heatmap of differentially expressed downstream genes in RUNX1 and RUNX1-IT1 knockdown PANC-1 cells and the corresponding control cells (P < 0.05, fold change > 2). b Top 30 enriched pathways in RUNX1 and RUNX1-IT1 knockdown PANC-1 cells. c GSEA analysis of the RUNX1 and RUNX1-IT1 knockdown PANC-1 groups and the control. d The levels of downstream TNF genes in the RUNX1 and RUNX1-IT1 knockdown PANC-1 groups were analyzed by qRT-PCR and compared with those in the control group. e The Venn diagram shows three targets in the area common to the four groups, namely, RUNX1-IT1 downstream genes, RUNX1 downstream genes (fold change > 2, P < 0.05), RUNX1-IT1 TNF core enriched genes and RUNX1 TNF core enriched genes (P < 0.05). f Correlation analysis between C-FOS and RUNX1 and between C-FOS and RUNX1-IT1 in GEO (GSE15471). g, h The C-FOS gene expression levels in the RUNX1-IT1 knockdown and RUNX1 knockdown groups were analyzed by qPCR. i The C-FOS gene expression levels in the NC, ex-RUNX1-IT1 and ex-RUNX1-IT1+sh-RUNX1 groups were analyzed by qRT-PCR. j The protein expression levels of C-FOS-related downstream molecules in the C-FOS knockdown PC and control cells were assessed by WB. k, l The protein expression levels of C-FOS and its related downstream molecules in the RUNX1-IT1 knockdown and RUNX1 knockdown groups were assessed by WB. m The protein expression levels of C-FOS and its related downstream molecules in the NC, ex-RUNX1-IT1 and ex-RUNX1-IT1 + sh-RUNX1 groups were assessed by WB (*P < 0.05, **P < 0.01, ***P < 0.001).

