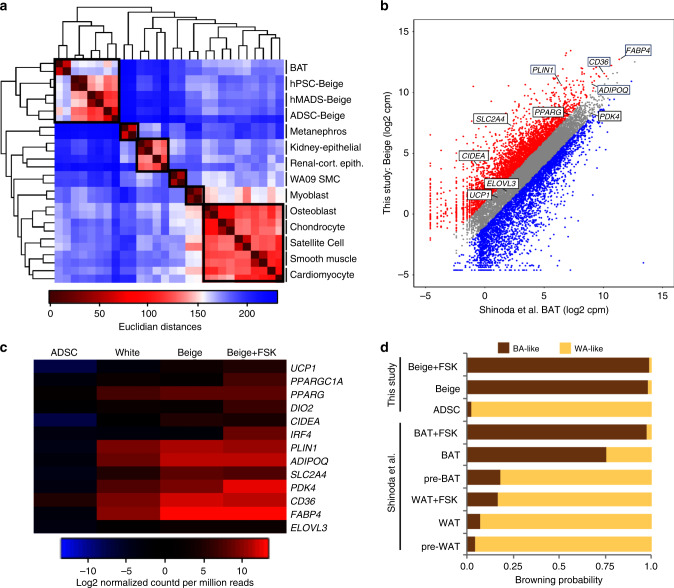
Fig. 2. Global transcript analysis of ADSC-derived beige adipocytes.
a Hierarchical clustering dendrogram comparing ADSC-derived beige adipocytes to other primary human cell types. Boxes indicate cell types with similar Euclidian distances. b Scatter plot comparing global transcriptomes of ADSC-derived beige adipocytes and human brown adipocytes33. Transcripts typically expressed in thermogenic adipocytes at elevated levels are indicated. Gray data points represent less than twofold difference between data sets, red data points represent less than twofold increase in this study and blue data points represent less than twofold increase in brown adipocytes. c Heatmap of RNA-seq data focusing on transcripts typically enriched in thermogenic adipocytes. ADSCs, white adipocytes, and ADSC-derived beige adipocytes ± forskolin, FSK (20 μm, 6 hours) are shown. d ProFAT37 computational analysis from reference data sets that integrates 97 human brown and white adipocyte samples, compared with the RNA-seq from ADSC-derived beige adipocytes. The browning probability score was determined from the correlation between the reference data sets and the ADSC-derived beige adipocyte data set. Data for beige, white (WA), and brown (BA) adipocytes were analyzed through this pipeline.

