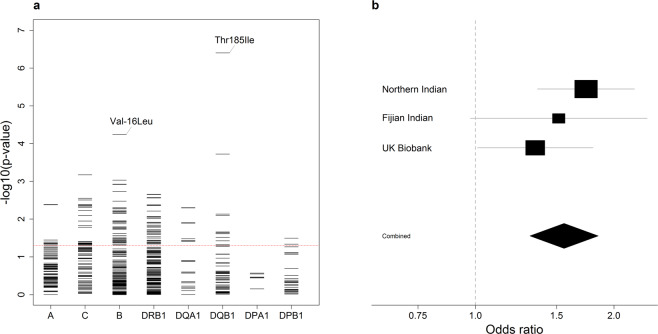
Figure 3.
Amino acid variants following HLA imputation. (a) For each locus, the negative common logarithm of the P value from LMM analysis is plotted for each amino acid polymorphism defined by HLA imputation. For HLA-DQB1 Thr185Ile and HLA-B Val-16Leu, the effect is shown in a single direction only. (b) Forest plot for the presence of isoleucine at position 185 in HLA-DQB1. For each population, the black squares centre on the odds ratio estimate from LMM on a logarithmic scale; the size of the square is proportional to the weight of the analysis. The horizontal line through each square corresponds to the confidence intervals. The black diamond centres on the combined effect estimate by fixed effects meta-analysis and stretches to the confidence intervals; the dashed line indicates no effect.

