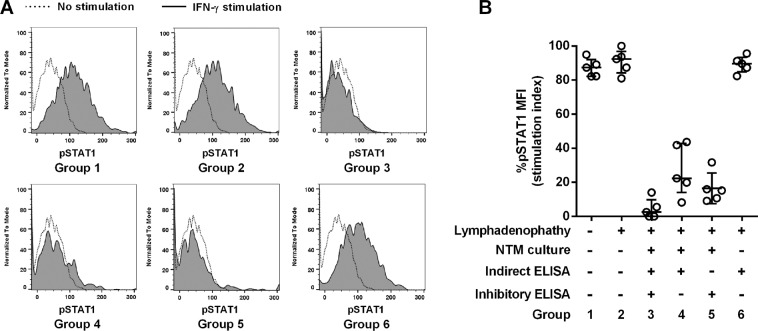
Figure 2.
Plasma anti-IFN-γ autoantibodies identified by indirect and/or inhibitory ELISA neutralized phosphorylation of STAT1. Recombinant human IFN-γ 200 ng/ml was pre-incubated with each plasma sample at a 1:10 dilution before being cultured with 104 CD14-FITC-labeled human PBMCs for 30 min. Phosphorylation of STAT1 (pSTAT1) was stained intracellularly and analyzed by flow-cytometer. Representative histograms of pSTAT1 signal of CD14 positive cells compared with no stimulation (dotted line) and IFN-γ stimulation (tinted black line) are shown (A). Median fluorescent intensity (MFI) from each sample from different groups was calculated as % pSTAT1 MFI stimulation index = (MFI plasma + IFN-γ – MFI unstimulated/MFI IFN-γ – MFI unstimulated) × 100. A scatter dot plot of % pSTAT1 MFI stimulation index of 5 plasma samples from each group shows the median line and interquartile range (B).

