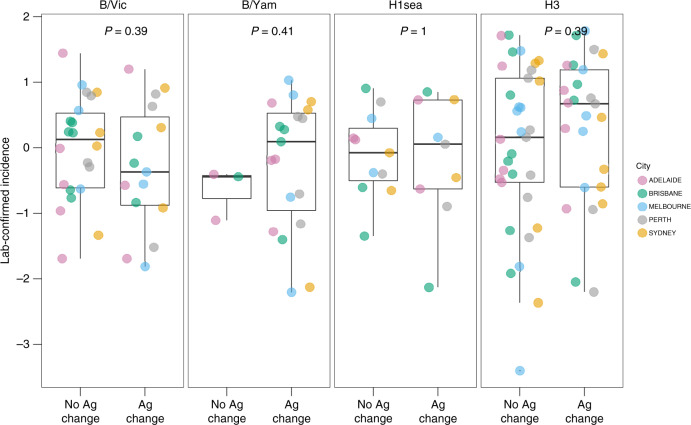
Fig. 3. Effect of antigenic change on epidemic incidence.
Epidemic incidence was compared between seasons associated with and without the epidemic-level circulation of a new major antigenic variant. Within each subtype, the incidence for individual epidemics was log-transformed and subtracted by the city-specific mean of log incidence, to allow for comparison between cities. P values are from Wilcoxon two-sample tests (n = 37, 26, 22 and 63 for B/Vic, B/Yam, A/H1sea and A/H3, respectively). Each point corresponds to one epidemic in a city, and the box plots show the median, first and third quartile of the transformed values, and range.

