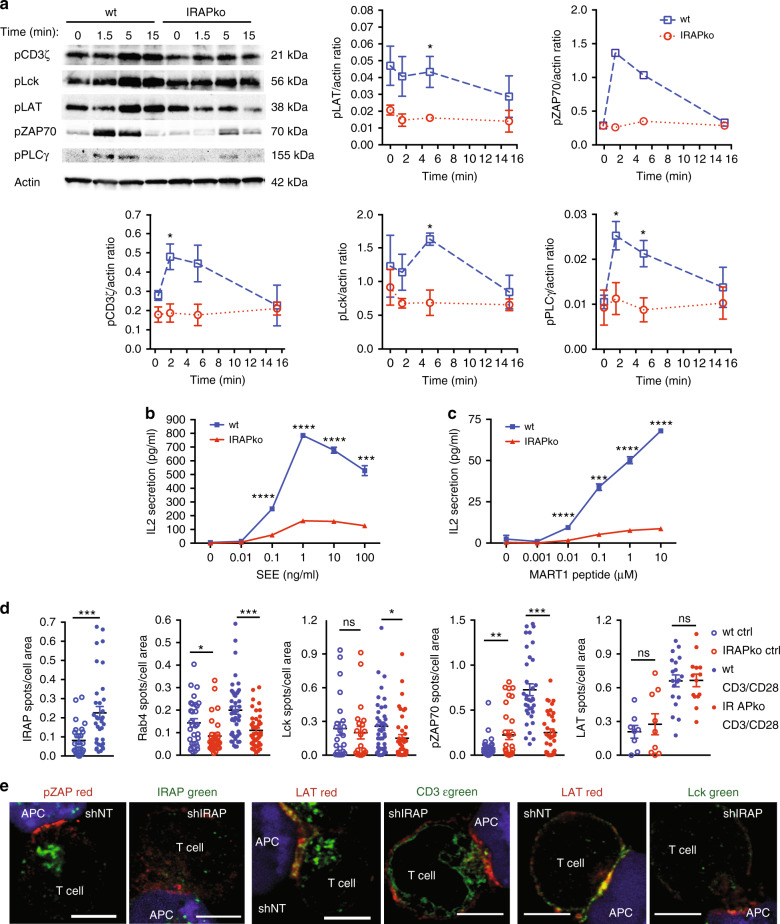
Fig. 2. IRAP is required for proper TCR signalling and activation of Jurkat T cells.
a Immunoblot analysis of TCR signalling molecules in wt and IRAP ko Jurkat T cells after activation by anti-CD3ε/CD28 for various time points. Values represent mean ± SEM of pool of three independent experiments for all signalling components excepting pPLCγ (n = 4) and pZAP70 (n = 2). pLAT *p = 0.0429, pCD3ζ *p = 0.0231, pLck *p = 0.0107, pPLCγ *p1.5 min = 0.0262, *p5 min = 0.0199. b, c IL-2 response of Jurkat T cells measured by ELISA: b wt or IRAP ko Jurkat T cells were incubated for 6 h with Raji B cells presenting the SEE superantigen, c wt or IRAP ko Jurkat T cells expressing the MART1 TCR were incubated overnight with Daju-A2 cells presenting the MART1 peptide. Values represent mean ± SEM of three replicates of one representative experiment of three independent experiments. SEE ****p < 0.0001, ***p = 0.0004, MART1 ****p < 0.0001, ***p = 0.0002. d Quantification of TIRF microscopy of IRAP, Rab4, Lck, pZAP70 and LAT membrane recruitment in CD3ε/CD28-activated Jurkat T cells. Wt or IRAP ko Jurkat T cells were activated (CD3/CD28) or not (Ctrl) for 10 min on CD3ε/CD28-coated slides, fixed and stained for IRAP or pZAP70 or LAT. For Rab4 and Lck, cells were transfected with Rab4-GFP and Lck-GFP, respectively. Each dot represents a cell (IRAP: wtCtrl n = 28, wtCD3/CD28 n = 34, ***p = 0.0005; Rab4: wtCtrl n = 30, wtCD3/CD28 n = 46, IRAPkoCtrl n = 30, IRAPkoCD3/CD28 n = 45, *p = 0.016, ***p = 0.0001; Lck wtCtrl n = 23, wtCD3/CD28 n = 41, IRAPkoCtrl n = 21, IRAPkoCD3/CD28 n = 42, *p = 0.033; pZAP70 wtCtrl n = 33, wtCD3/CD28 n = 35, IRAPkoCtrl n = 31, IRAPkoCD3/CD28 n = 34, **p = 0.009, ***p = 0.0001; LAT wtCtrl n = 8, wtCD3/CD28 n = 19, IRAPkoCtrl n = 9, IRAPkoCD3/CD28 n = 14). Values represent mean ± SEM. All p-values (a, b, c, d) were calculated with two-tailed unpaired t tests. e Confocal microscopy of SEE-pulsed Raji B cell/Jurkat T-cell conjugates. Cells were stained for: Lat (red), Lck (green)—right panel, Lat (red), CD3ε (green)—middle panel and pZAP70 (red), IRAP (green)—left panel. Bars represent 5-μm scale. Images are representative of three independent experiments. For additional information, see Supplementary Fig. 2.

