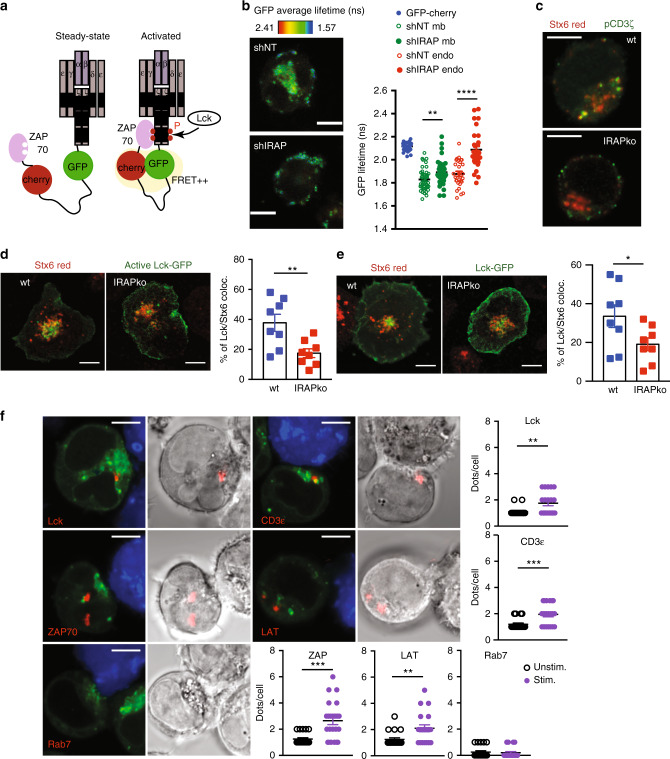
Fig. 3. The TCR signals from IRAP/Stx6+ intracellular compartments.
a CD3ζ reporter composed of a CD3ζ chain followed by a GFP molecule, an mCherry molecule and an SH2 domain of ZAP-70. At the activated state, Lck phosphorylates the CD3ζ ITAMs, which then recruit the SH2 domain of ZAP-70. Then GFP and mCherry come to a distance where FRET can occur. b Representative images and quantification of GFP average lifetime in CD3ε/CD28-activated Jurkat T cells. Jurkat T cells expressing the CD3ζ reporter and transduced with either shNT or shIRAP lentivirus were activated on CD3ε/CD28-coated slides for 10 min, fixed and GFP average lifetime was measured by FRET–FLIM. Green symbols represent quantification at the plasma membrane (mb), and red symbols quantification in endosomes (endo). Each dot represents an individual cell (GFP n = 46; GFP-mCherry n = 38; wt mb n = 43; ko mb n = 39; wt endo n = 28; ko endo n = 30, **p = 0.0064, ****p < 0.0001). Bars represent 5-μm scale. c Wt or IRAP ko Jurkat T cells were activated on CD3ε/CD28-coated slides for 10 min and stained with anti- CD3ζ pY142 and anti-Stx6 antibodies. Bars represent 5-μm scale. d, e Colocalization of Stx6 (red) with Lck (green) in wt or IRAP ko Jurkat T cells transfected with Lck(Y505F)-GFP (d, n = 8 wt, n = 8 IRAP ko cells, **p = 0.0070) or Lck-GFP (e, n = 8 wt, n = 8 IRAP ko cells, *p = 0.0486). Bars represent 5-μm scale. f Duolink proximity ligation assay of IRAP with various signalling proteins on conjugates formed by Raji B cells presenting SEE superantigen to wt Jurkat T cells expressing Rab4-GFP. Interactions of less than 40-nm distance between the two proteins appear as a red dot. Zoom, original magnification × 4. Bars represent 5 μm scale. At least 20 cells per condition were quantified. Lck **p = 0.0027, CD3ε ***p = 0.0008, ZAP ***p = 0.0001, LAT **p = 0.0054. Each dot represents an individual cell, and all values represent mean ± SEM (b, d, e, f). All p-values were calculated with two-tailed unpaired t tests. For additional information, see Supplementary Fig. 3.

