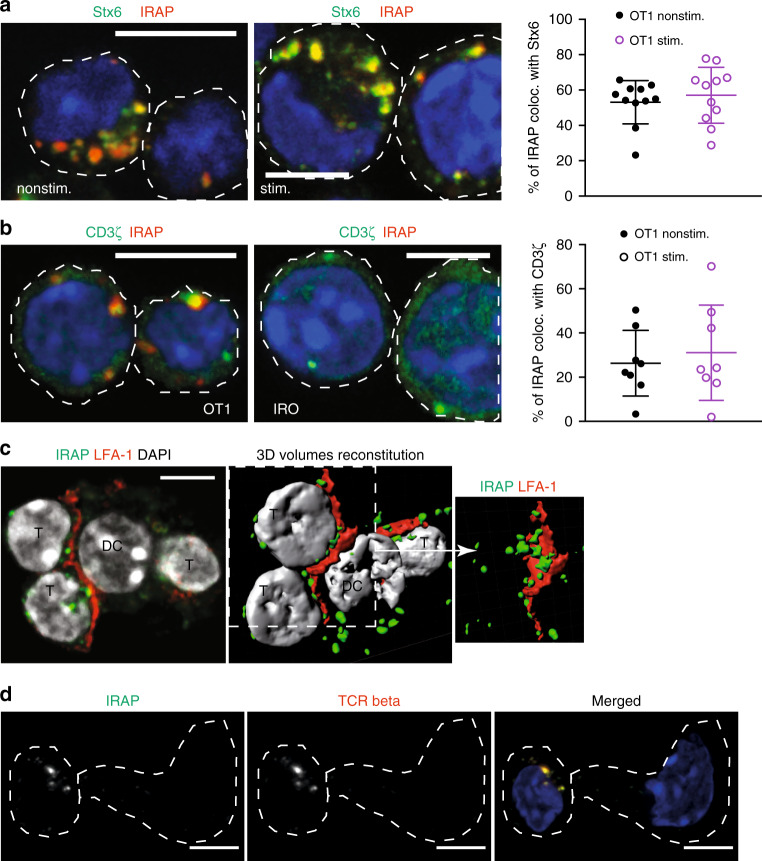
Fig. 5. IRAP colocalizes with the TCR in primary murine T cells.
a OT1 effector T cells were spread on poly-lysine (nonstim.) or CD3ε-coated (stim.) slides for 10 min, fixed and stained with antibodies specific for IRAP and Stx6. Each dot represents a cell (n = 11 cells per condition). Bars represent 5-μm scale. b OT1 T cells were spread on CD3ε-coated slides for 10 min, fixed and stained with antibodies specific for IRAP and the ζ chain (n = 8 cells per condition). Bars represent 5-μm scale. Images are representative of two independent experiments. c Confocal microscopy and tri-dimensional reconstitution of conjugates formed by SIINFEKL-pulsed dendritic cells and OT1 naive T cells. After fixation, the cells were stained with specific antibodies for LFA-1 (red), IRAP (green) and DAPI (grey). Images are representatives for two independent experiments. Bars represent 5-μm scale. d Confocal microscopy of conjugates formed by SIINFEKL-pulsed dendritic cells and OT1 naive T cells. After fixation, the cells were stained with specific antibodies for IRAP (green) and TCRb (red). Bars represent 5-μm scale. Images are representatives for two independent experiments.

