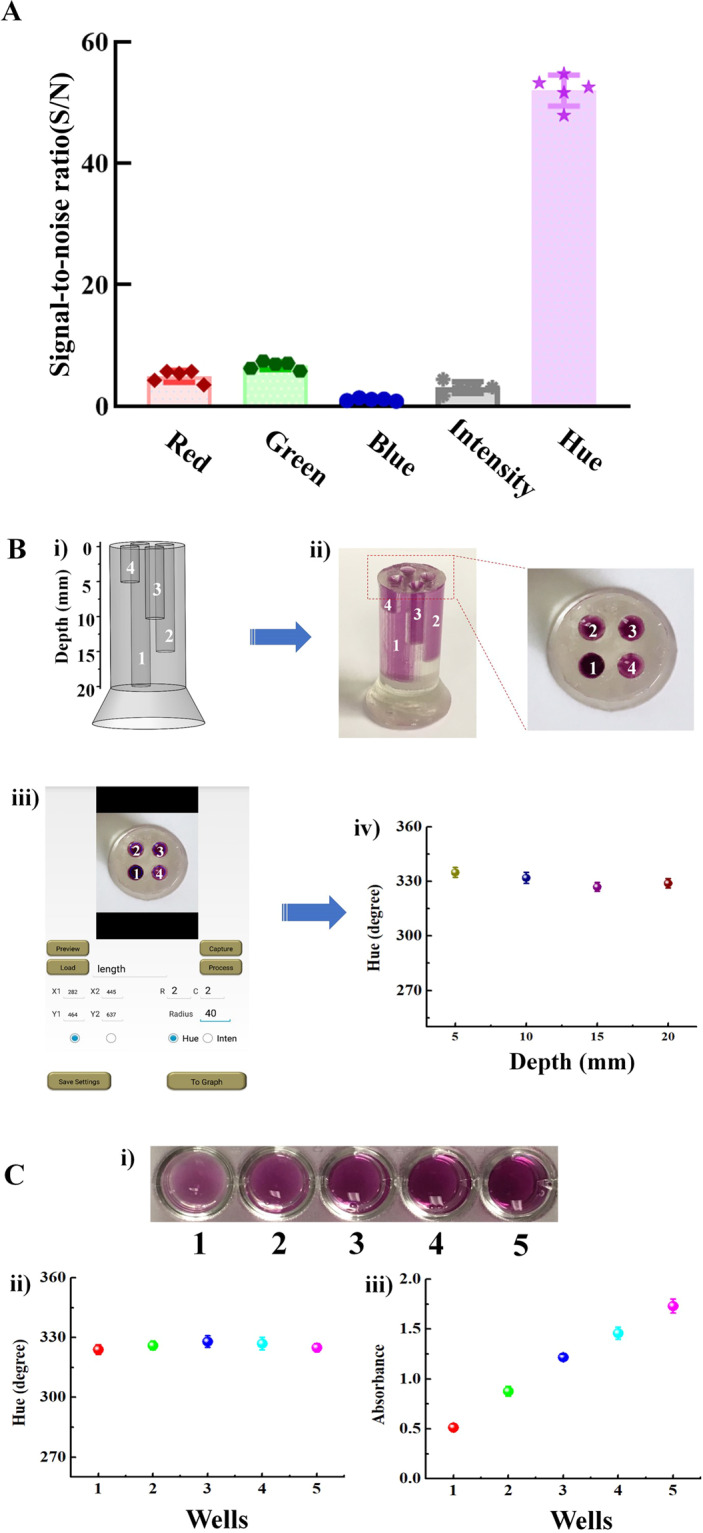
Figure 2.

Hue-based colorimetric analysis. (A) Comparison of signal-to-noise (S/N) of RGB model and hue value analysis (HSI model) in colorimetric LAMP assay. (B) 3D printed device containing four cylindrical chambers with various depths (5, 10, 15 and 20 mm) for hue value measurement of the EBT indicator: i) schematic illustration of the 3D printed device; ii) a photograph of the device filled with the EBT indictor; iii) the interface of our smartphone app for hue value quantitative measurement and iv) Hue value (in degree), as a function of the depths of the chambers (in mm). (C) Comparison of hue value detection and absorbance measurement of the EBT indicator solution with various volumes in 96-well plate. (n = 5).
