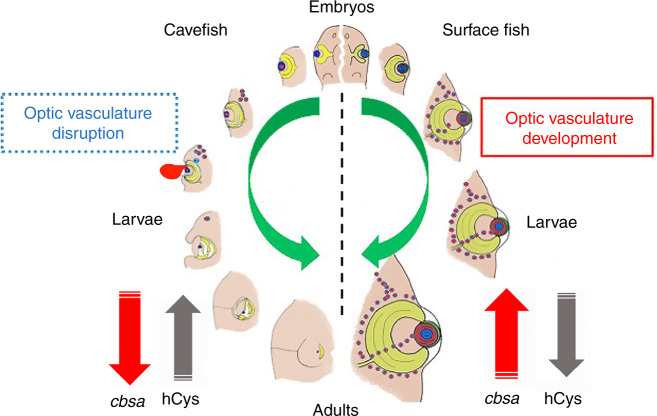
Fig. 10. A model for cavefish eye degeneration.
The model illustrates changes in cbsa expression (red upward pointing arrows indicate normal expression in surface fish; red downward pointing arrows indicate downregulated expression in cavefish) resulting in hCys elevation (black downward pointing arrows show normal hCys titers in surface fish; black upward pointing arrows indicate elevated titers in cavefish) and the induction of defects in optic vasculature (red dots surrounding and within developing eyes) that can result in hemorrhages in cavefish (red ellipse; left). Green arrows show trajectories of eye degeneration in cavefish larvae (left) or eye development in surface fish larvae (right).

