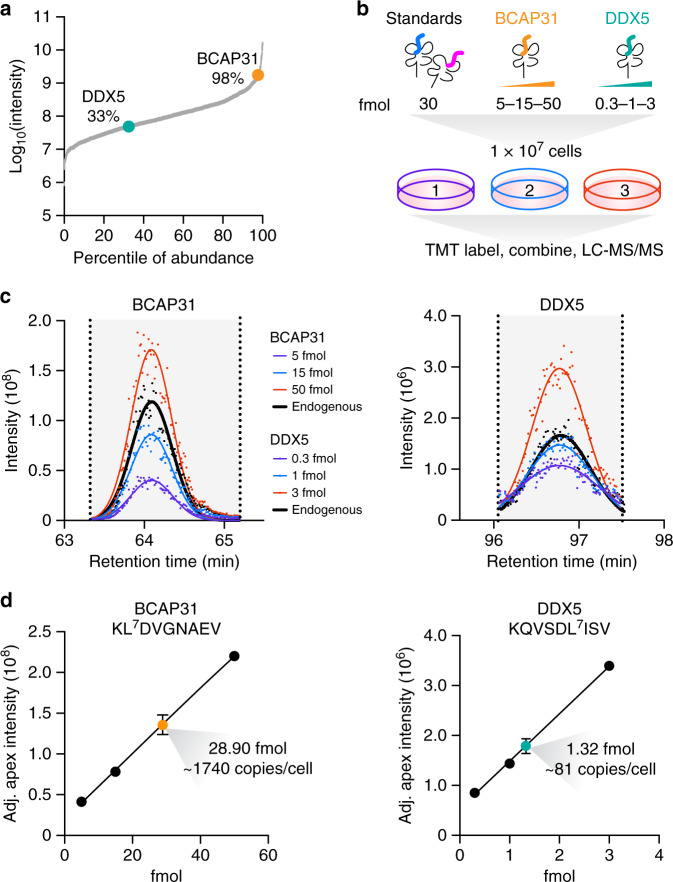
Fig. 3. Absolute quantification of pMHCs with hipMHC standards and isobaric labeling.
a Peptide intensities for TMT-labeled MDA-MB-231 cells from Fig. 2 were determined by AUC quantification. Percentile of abundance represents a peptide’s rank relative to the most abundant peptide. b Experimental design. Normalization standards along with 5, 15, and 50 fmol of BCAP31 and 0.3, 1, and 3 fmol of DDX5 hipMHCs were added to three biological replicates of 1 × 10⁷ MDA-MB-231 cells, and peptides from MHC complexes were isolated, labeled, and analyzed via LC-MS/MS. c Chromatographic elution profiles for the three TMT reporter ion intensities of the hipMHC standard curve (colored), along with the average (n = 3) TMT reporter ion intensity trace of the endogenous peptide (black). Each MS2 scan is represented as a single point, and elution profiles are fitted with a gaussian distribution (line). d Adjusted (hipMHC normalized) apex intensity versus fmol of hipMHC added creates a standard curve from which the endogenous concentration of antigen is calculated. For both linear fits of BCAP31 and DDX5, r2 > 0.999. The endogenous peptide is presented as the mean value ± SD for n = 3 biological replicates. Source data are provided in the Source data file.

