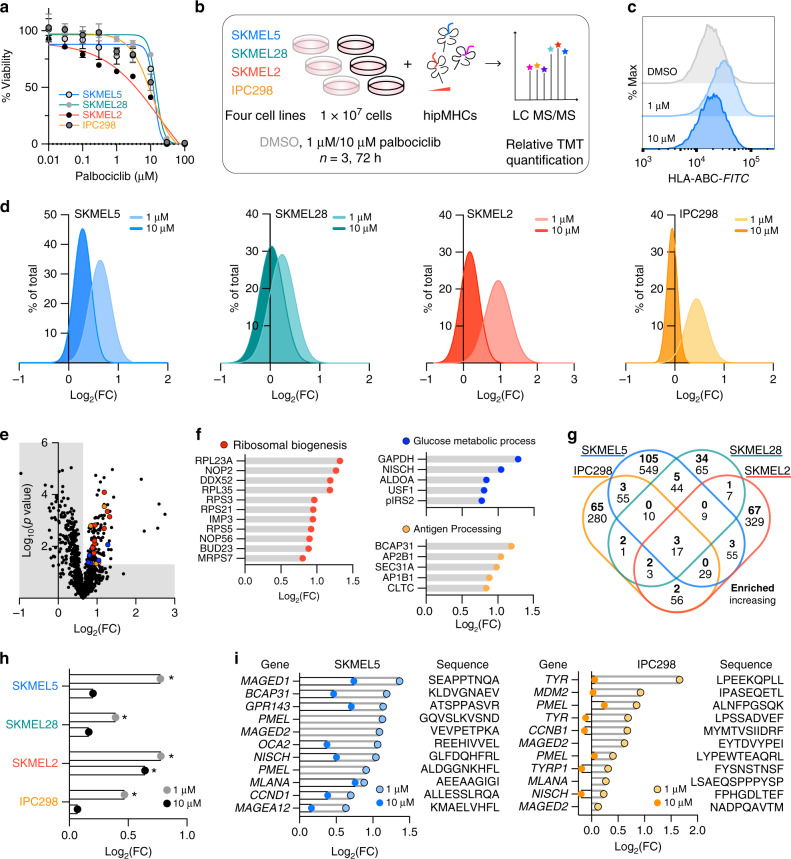
Fig. 4. Palbociclib alters the immunopeptidome in melanoma.
a Viability at 72 h after drug treatment; data are represented as a fraction (%) of the DMSO control. Calculated IC50s: SKMEL5 = 12.74 μM, SKMEL28 = 14.62 μM, SKMEL2 = 16.98 μM, and IPC298 = 10.62 μM. Data are presented as mean values ± SD for n = 3 experimental replicates for all cell lines, except SKMEL5 (n = 4). b Experimental setup of TMT-labeled immunopeptidomics experiments in melanoma cell lines. c Flow cytometry measurements of surface HLA expression in SKMEL5 cells. Data are represented as % of maximum signal, and the distributions are representative of three independent experiments. d Histogram distribution of log2 fold change (FC) of (palbociclib/DMSO) for unique pMHCs, where FC is calculated from the mean intensity of n = 3 biological replicates per condition. Data are represented as a % of total unique peptides identified. e Volcano plot displaying log2(FC) of 1 μM treated SKMEL5 cells versus significance (mean-adjusted p value, unpaired two-sided t test). Colored points (p < 0.05, log2(FC) > 1.56) correspond to processes in f. f Log2(FC) of significantly enriched peptides from GO term enrichment processes labeled with source protein name. False discovery rate (FDR)-adj. p value < 0.05. g Four-way Venn diagram of the number of source proteins of peptides significantly enriched (top value) or significantly increasing (bottom value) with 1 μM palbociclib. h Log2(FC) of pIRS2 peptide following 1 μM (gray) or 10 μM (black) palbociclib, *p < 0.05, unpaired two-sided t test. i Source protein name, peptide sequence, and log2(FC) of TAAs in SKMEL5 (left) and IPC298 (right) cells. Exact significance values and other source data are reported in the Source Data File.

