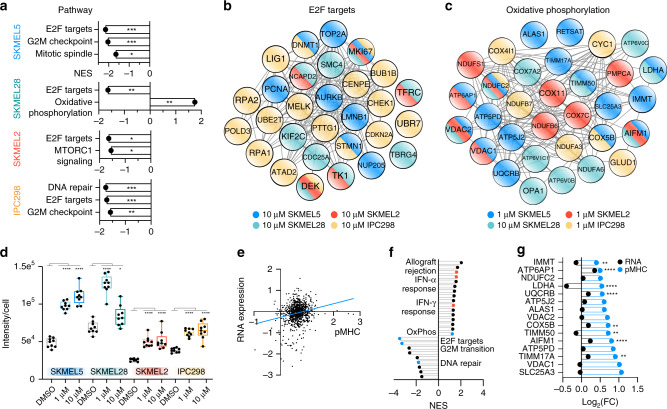
Fig. 5. Pathway analysis of palbociclib-altered immunopeptidome.
a Normalized enrichment score (NES) of significantly enriched pathways with 10 μM palbociclib, where +/− NES scores reflect enrichment directionality. For all, q < 0.25, and *p < 0.05, **p < 0.01, and ***p < 0.001. b, c String network of protein–protein interactions of all source proteins from E2F peptides (b) significantly decreasing with 10 μM palbociclib, and OxPhos peptides (c) significantly increasing with 1 μM palbociclib for all cell lines, except SKMEL28, where peptides from 10 μM are depicted. Node color corresponds to cell line. d Quantification (n = 9) of MitoTraker green intensity normalized to cell number following 72 h palbociclib treatment. Data are represented as a box and whiskers plot, with whiskers displaying minimum and maximum signal. Significance was determined using Dunnett’s multiple comparisons test for each condition versus DMSO. *p < 0.05 and ****p < 0.0001. e Correlation between log2 fold change (FC) of (palbociclib/DMSO) for RNA expression (y-axis) and pMHC presentation (x-axis) of SKMEL5 cells treated for 72 h with 1 μM palbociclib, r2 = 0.04. FC is calculated from the mean intensity of n = 3 biological replicates per condition. f Significantly enriched pathways using RNA-seq data (p < 0.05, q < 0.25). Annotated pathways reflect pathways also identified in the immunopeptidome analysis (blue), and those that match with previous reported data (red)7. g Log2(FC) for SKMEL5 OxPhos peptides significantly increasing (p < 0.05, blue) with 1 μM palbociclib, and matched log2(FC) of RNA expression (black). Significant differences in RNA expression (palbociclib versus DMSO) are indicated. **p < 0.01 and ****p < 0.0001 (Wald test, Benjamini–Hochberg (BH) adjusted). Exact significance values and other Source data are reported in the Source Data File.

