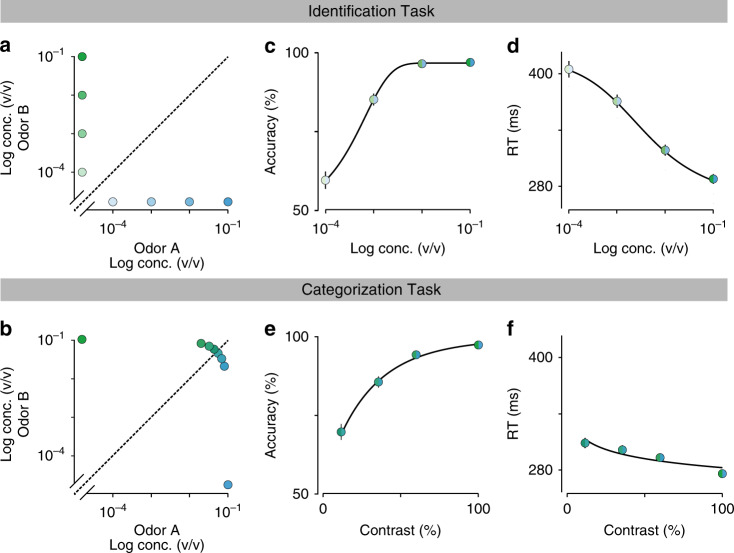
Fig. 2. Comparison between odor identification and mixture categorization tasks.
a, b Stimulus design. In the odor identification task, the odorants were presented independently at concentrations ranging from 10−1 to 10−4 (v/v) and sides rewarded accordingly (a). For the mixture categorization task, the two odorants were mixed in different ratios presented at a fixed total concentration of 10−1, and rats were rewarded according to the majority component (b). Each dot represents one of the 8 stimuli presented for each task. c, d Mean accuracy (c) and mean reaction time (d) for the identification task plotted as a function of odor concentration. e, f Mean accuracy (e) and mean reaction time (f) for the categorization task plotted as a function of mixture contrast (i.e. the absolute percent difference between the two odors). Error bars are mean ± SEM over trials and rats. Colors in dots are presented as to help parse between stimulus space and psych- and chronometric curves. Solid lines depict the obtained fits for the predicted curves of a DDM, an exponential curve for performance and a hyperbolic tangent for RTs, as described in ref. 2.

