Figure 2.
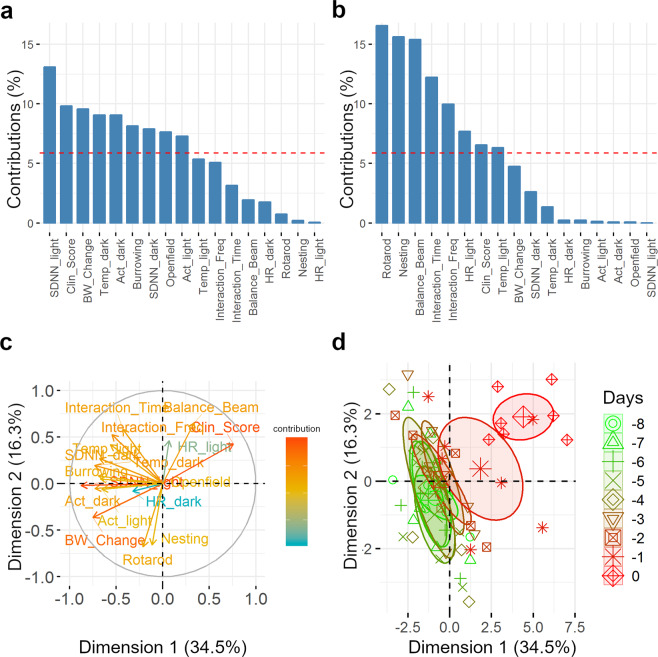
Principal component analysis of behavioural and physiological parameters for the last 8 days before the endpoint. Contribution of the different parameters to the first dimension (a) and the second dimension (b) are shown in per cent. The dashed line indicates the threshold for the equal contribution of each parameter. Illustration of the first two dimensions of the principal component analysis is shown as arrows (c). Length, direction and colour of the arrows code for the level of contribution of each parameter to the different dimensions. Clusters are based on the principal component analysis for each day (d). 95% confidence ellipses around group clusters (days) are shown as different colours and symbols for each day. BW_Change – body weight change (%); Clin_Score – clinical score; HR_dark – heart rate (dark phase, bpm); SDNN_dark – heart rate variability (dark phase, ms); Act_dark – activity counts (dark phase); Temp_dark – body temperature (dark phase, °C); HR_light – heart rate (light phase, bpm); SDNN_light – heart rate variability (light phase, ms); Act_light – activity counts (light phase); Temp_light – body temperature (light phase, °C); Burrowing – burrowed gravel (g); Openfield – distance traveled in the open field (m); Nesting – nest complexity; Balance_Beam – completion time of the balance beam test (sec); Rotarod – time until falling form the rod (sec); Interaction_Time – total interaction time (sec); Interaction_Freq – interaction frequency.

