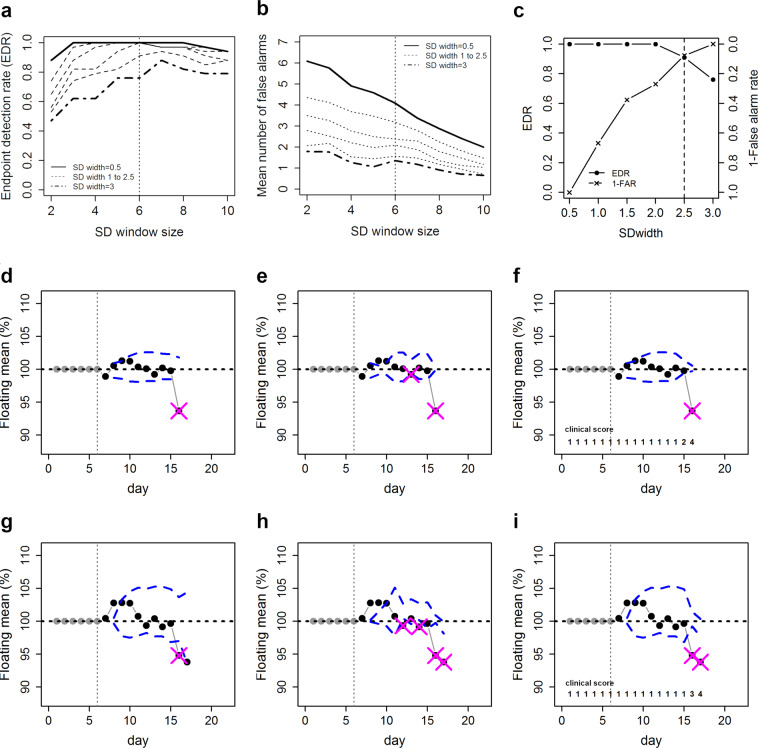
Figure 3.
Performance and evaluation of endpoint detection algorithm. (a) Endpoint detection rate and (b) mean number of false alarms per animal for different SD window sizes and SD widths. The optimal window size is indicated by a vertical dashed line. Endpoint detection rate and false alarm rate at the optimal window size of 6 days for different SD widths (c). Optimal SD width is indicated by the dashed line. Endpoint detection using normalized body weight change data with optimized settings (SD window size = 6, SD width = 2.5) in the regular mode (d,g), the MAD constrained mode (e,g) and score constrained mode (f,i) for two individual animals (d–f and g–i). Boundaries are indicated by the dashed lines and alarms by the crosses.

