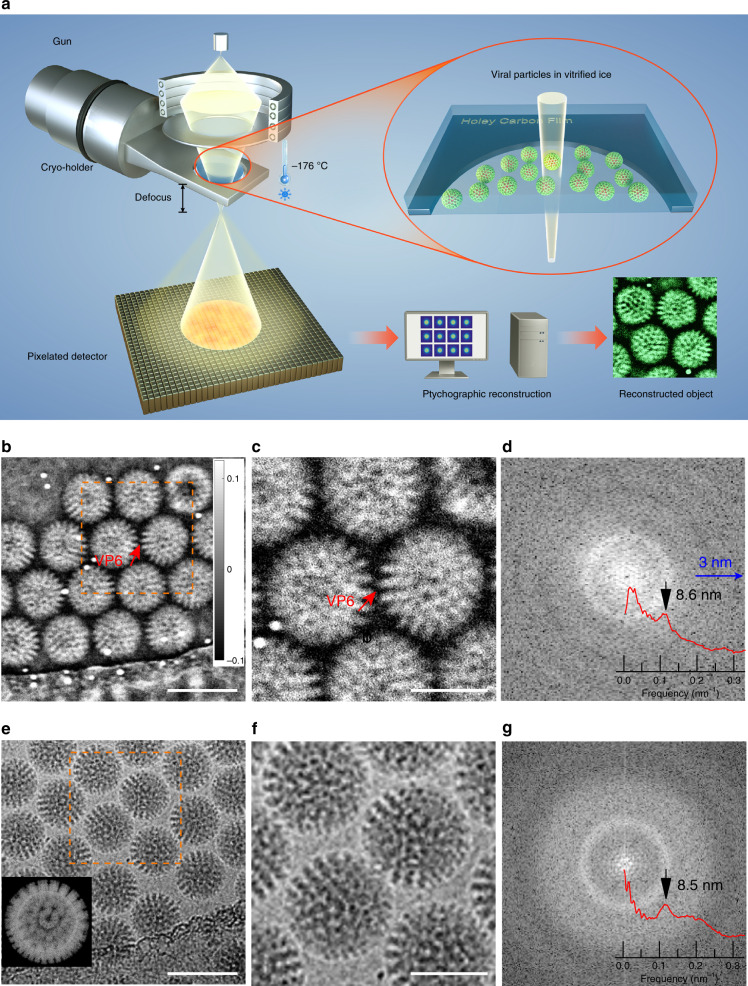
Fig. 1. Cryo-ptychographic configuration and reconstruction of rotavirus DLPs.
a Schematic diagram of the optical configuration. b Ptychographic reconstructed phase at a dose of 22.8 e/Å2 and e defocused TEM images at dose of 35 e/Å2 of rotavirus DLPs in vitrified ice. c, f Magnified views of sub areas marked in b and e with orange squares, respectively. The red arrows in b and c indicate the capsid trimers of viral protein 6 (VP6). The ~6 nm gold particles are displayed as bright features in b and c following established convention where a phase advance (+) is displayed as white53 and appears as a contrast reversal compared to conventional TEM images. d, g Power spectra calculated from b and e, respectively including radial averages (inset). A rotavirus DLP model is shown in e (inset). The gray scale bar in b is in radians and applies to b and c. Scale bars: 100 nm in b and e, 50 nm in c and f.

