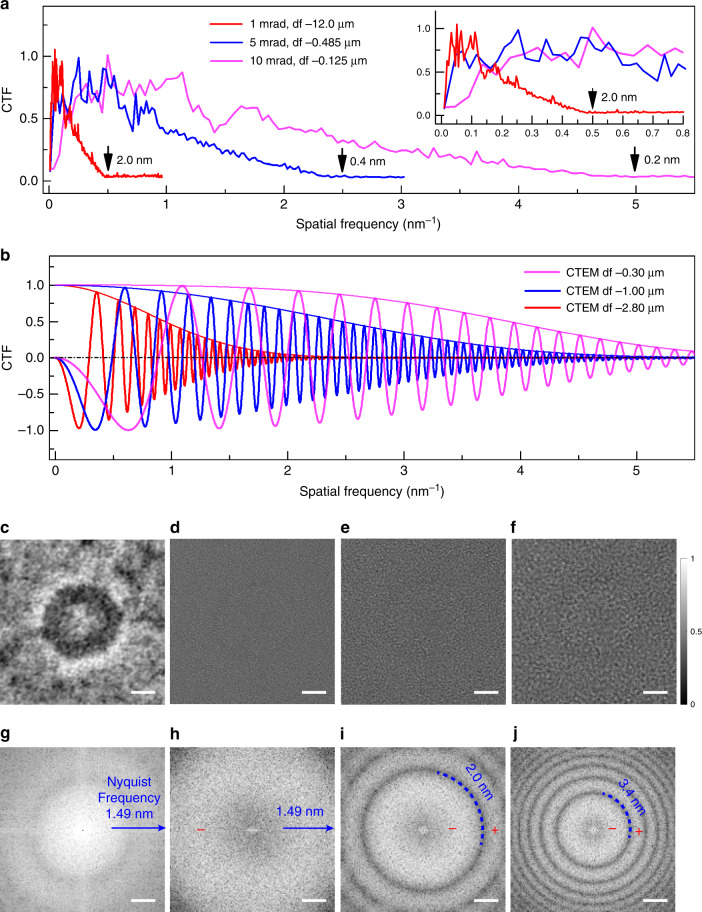
Fig. 2. CTFs and comparisons of ptychography and defocused TEM.
a Simulated ptychographic phase CTFs for different convergence semi-angles with Poisson noise; 1 mrad (red line), 5 mrad (blue line), 10 mrad (magenta line) at an accelerating voltage of 80 kV. b Conventional phase CTFs of noise free for images simulated at different defoci: −0.3 µm (magenta line), −1.0 µm (blue line), −2.8 µm (red line) using envelope functions calculated according to refs. 54–56 at an accelerating voltage of 80 kV. c Experimental reconstructed ptychographic phase at dose of 146 e/Å2 and TEM images at defoci of d −0.32 μm, e −1.0 μm, f −2.8 μm at dose of 180 e/Å2, of a resin embedded Adenovirus particle recorded at room temperature. For comparison, the ptychographic phase and TEM images are displayed normalized to a range of 0 to 1. Power spectra calculated from g the ptychographic phase and h to j TEM images. Additional calculation parameters are given in Supplementary Tables 2 and 3. The reconstructed ptychographic phase and CTEM images are both displayed normalized to a range of 0 to 1 corresponding to the greyscale on the right of f. Scale bars: 25 nm in c to f and 0.2 nm−1 in g to j.

