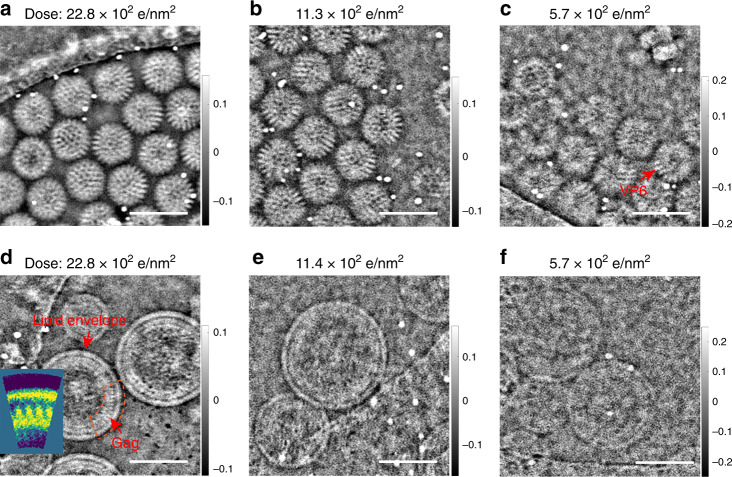
Fig. 3. Low-dose cryo-ptychographic reconstruction of viral particles.
Reconstructed phase of rotavirus DLPs at doses of a 22.8 e/Å2, b 11.3 e/Å2 and c 5.7 e/Å2. The red arrow in c indicates the VP6 trimers. Reconstructed phase of non-symmetrical immature HIV-1 VLPs at doses of d 22.8 e/Å2, e 11.4 e/Å2 and f 5.7 e/Å2. The red arrows in d indicate the HIV-1 Gag protein and the lipid envelope. Inset to d is a rotational average of the sub-region indicated by the orange dashed line, (for details see Supplementary Fig. 10 and Supplementary Note 7). Scale bars: 100 nm.

