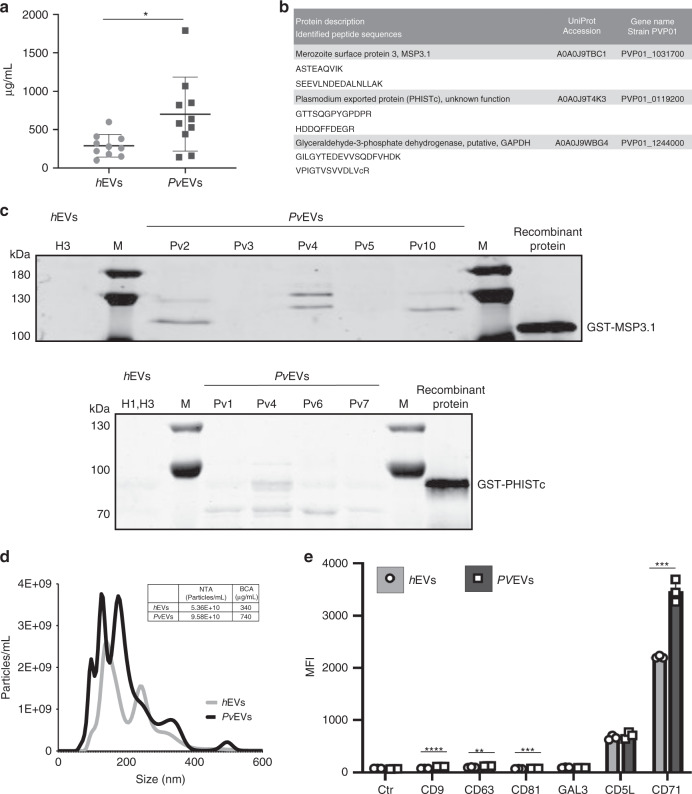
Fig. 1. Characterization of plasma-derived extracellular vesicles from P. vivax patients.
a BCA (protein concentration) of circulating EVs from healthy donors (hEVs) and P. vivax patients (PvEVs) (n = 10, individual samples). Data show mean ± SD. Two-sided, Mann–Whitney test, *p = 0.0232 (GraphPad). b P. vivax proteins identified by different unique peptides (sequences below the description of corresponding proteins). UniProtKB accession numbers and gene name corresponding to the P. vivax PvP01 strain are shown. c Western blot analysis of PvEVs obtained from different individual patients (Pv1-7 and Pv10) and human donors (H1 and H3) using anti P. vivax MSP3.1 (upper membrane) and PHISTc (bottom membrane) antibodies. MSP3.1 and PHISTc recombinant truncated-proteins fused to GST, were used as positive controls. Molecular weight in kDaltons (kDa) is shown to the left. M: molecular size marker. Image representative of three independent experiments. d Nanoparticle tracking analysis (NTA) profile (size [nm] versus concentration [particles/mL]) of pooled hEVs and PvEVs was analysed using NanoSight LM10-12. Table shows mean of three measurement of pooled hEVs and PvEVs quantified by NTA (particles concentration) and BCA (protein concentration). e Beads-based flow cytometry analysis of pooled hEVs and PvEVs using six EV markers (CD9, CD63, CD81, GAL3, CD5L and CD71). Data show median fluorescence intensity (MFI) of each antibody and control antibodies (rabbit and mouse-isotype) ± SD (technical replicates, n = 3). Unpaired and two-sided, t-test **p = 0.0032 (CD63), ***p = 0.0006 (CD81, CD71), ****p < 0.0001 (CD9) (GraphPad). Source data are provided as a Source data file and Supplementary Data 2, 3 and 4.

