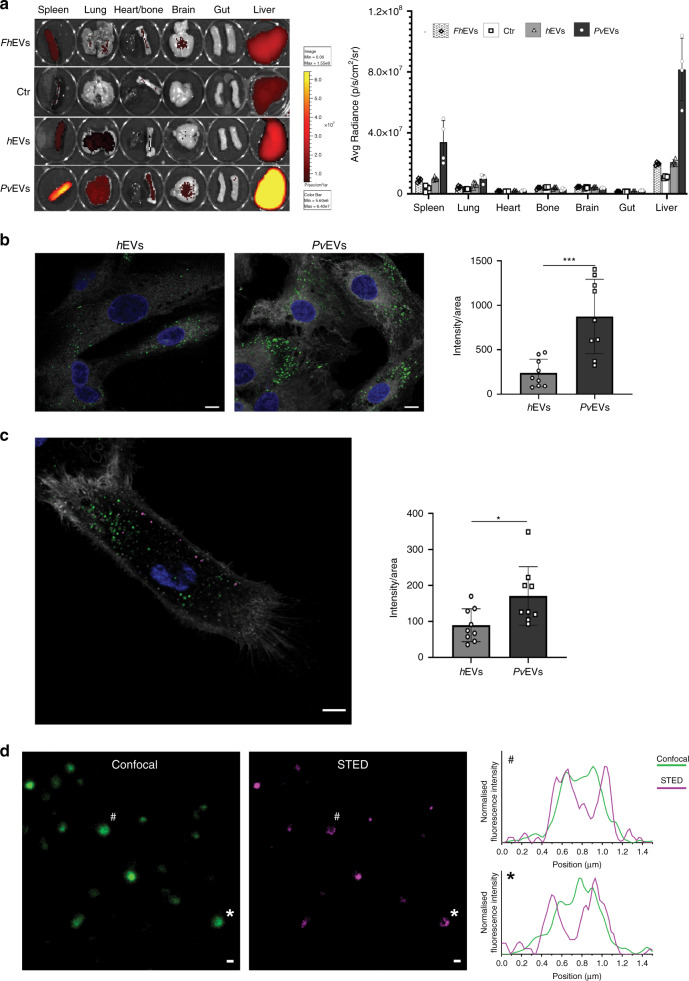
Fig. 2. In vivo distribution of EVs and taken up experiments.
a Representative IVIS-Spectrum images (left) and quantification of EVs signal to each organ (right). Three micrograms of Burgundy-labelled pooled EVs (FhEVs, hEVs and PvEVs), quantified by BCA and corresponding, respectively, to 9.08E + 9, 1.50E + 10 and 1.38E + 10 particles as measured by NTA, and Burgundy-labelled media as control, were injected retro-orbitally into C57Bl mice (n = 4, individual animals). After 1 h, mice were sacrificed to analyse several organs as indicated. Data show mean ± SD. b, c Uptake experiments. Confocal images (left) and quantification (right) of EVs uptaken by each cell (n = 9 cells examined over one independent experiment) after 2 h incubation. Data representative of three independent experiments. Nucleus was stained with Hoechst® 33342 (blue), and cell membrane with Cell Mask™ (white). Scale bar: 10 µm. b Pooled hEVs and PvEVs were individually stained with PKH67 (green). Data show mean ± SD. Two-sided, Mann–Whitney test, **p = 0.0008 (GraphPad). c Pooled hEVs and PvEVs were stained with PKH26 (magenta) and PKH67 (green), respectively, and competitively uptaken by hSFs. Data show mean ± SD. Two-sided, Mann–Whitney test, *p = 0.0244 (GraphPad). d Abberior STAR 580 stained PvEVs were incubated with hSFs for 2 h at 37 °C. Confocal (green) and STED (magenta) images of labelled EVs membranes (left), and line profiles of normalised fluorescence intensities of EVs indicated by # and * (right). Scale bar: 400 nm. Image representative of three independent experiments. Source data are provided as a Source data file.

