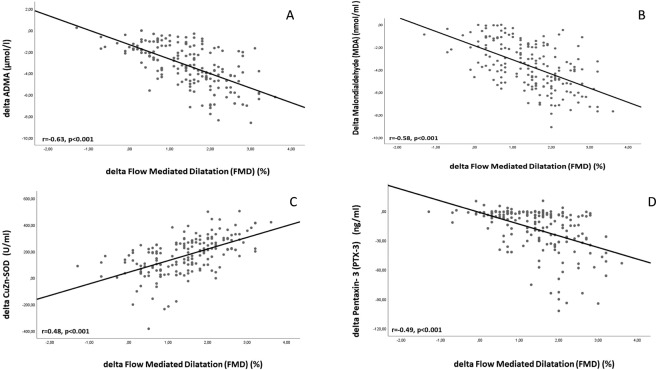
Figure 2.
Scatter-plot graphs between FMD and ADMA, MDA, CuZn-SOD, PTX-3. (A) The scatter plot showing the significant negative relationship between the changes (%) in ADMA and FMD during the 12-week AAL, AIC and AOL interventions. (B) The scatter plot showing the significant negative relationship between the changes (%) in MDA and FMD during the 12-week AAL, AIC and AOL interventions. (C) The scatter plot showing the significant negative relationship between the changes (%) in CuZn-SOD and FMD during the 12-week AAL, AIC and AOL interventions. (D) The scatter plot showing the significant negative relationship between the changes (%) in PTX-3 and FMD during the 12-week AAL, AIC and AOL interventions.

