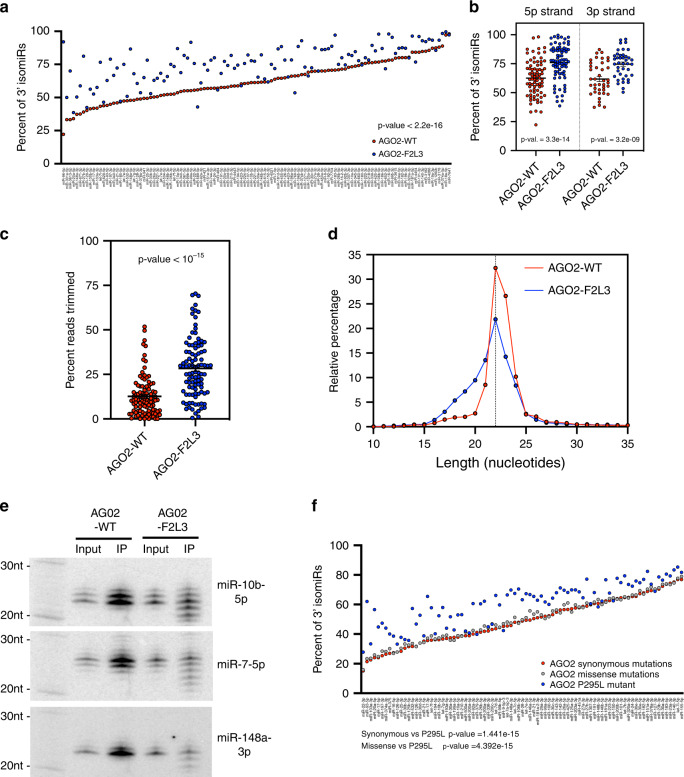
Fig. 2. Endogenous miRNAs with exposed 3′ ends undergo modification.
a Plot of percentage of isomiRs (y-axis) for the endogenous miRNA with highest expression (x-axis, N = 116 miRNAs) bound to AGO2-WT and AGO2-F2L3. Wilcoxon’s test for paired values was used to calculate the p value. b Plot of percentage of isomiRs. Unpaired Student’s t test was used for comparing endogenous miRNAs associated with AGO2-WT from miRNAs associated with AGO2-F2L3 (mean ± SEM, N5p-arm = 76 miRNAs, N3p-arm = 40 miRNAs). c Plot of percentage of trimmed reads in endogenous miRNA (mean ± SEM, N = 100 miRNAs). d Histogram of the length distribution in endogenous miRNA bound to AGO2-WT and AGO2-F2L3. e Detection of endogenous mature miRNA in input and FLAG-immunoprecipitate (IP) by Northern blot. f Plot of percentage of isomiRs for the endogenous miRNA with highest expression (N = 85) in TCGA samples with synonymous (51 patients), missense (81 patients), and P295L mutation on AGO2. Wilcoxon’s test for paired values (two-sided) were used to calculate the p values. Source data are provided as a Source Data file.

