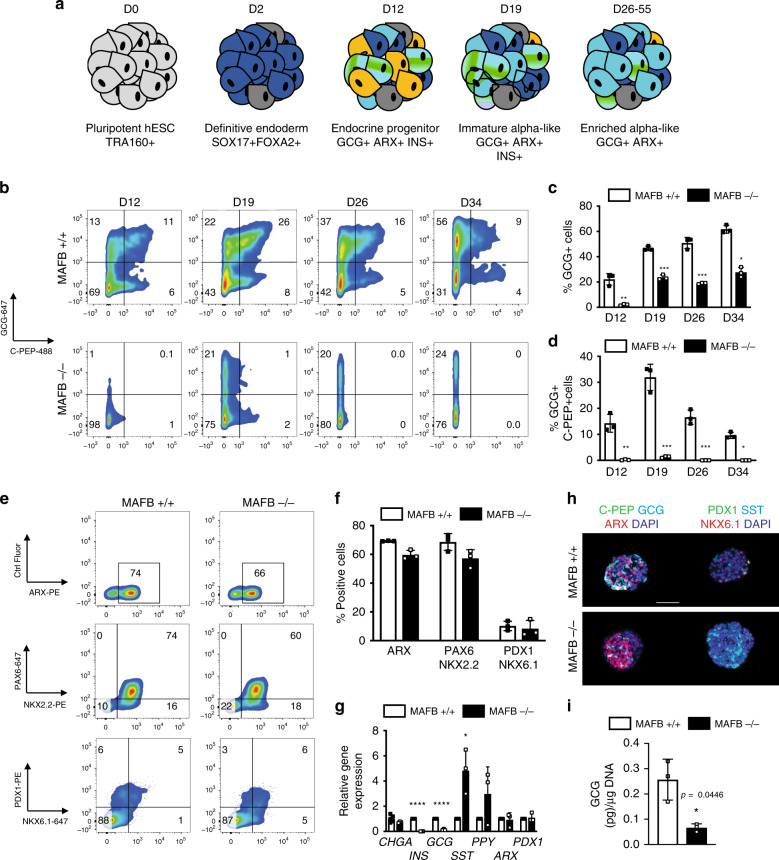
Fig. 6. Loss of MAFB limits α-cell differentiation.
a Schematic outlining the differentiation protocol to generate α-like cells from hESCs. The key lineage markers are outlined at each stage. Chemicals and durations for each differentiation stage are indicated in the Methods section. d, day(s); hESC, undifferentiated hESC stage; DE, definitive endoderm stage (SOX17 + FOXA2+); EP, endocrine progenitor (CHGA + PDX1+); immature α-like cells (GCG + INS + ARX+) and enriched α-like cells (GCG + ARX+). b Representative FC plots at the indicated time point depicting the percentages of GCG + C-PEP+ cells and quantification at the DE stage. c, d Quantification of FC data outlined in (b) (n = 3). P values by one-way ANOVA followed by Dunnett’s multiple comparisons test were *P < 0.05, **P < 0.01, ***P < 0.001, ****P < 0.0001. Data are presented as individual biological replicates and represent the mean ± SD. e Representative FC plots at the α-like cell stage depicting the percentages of ARX+, PAX6+ NKX2.2+, and PDX1+ NKX6.1+ cells. f Quantification of FC data in (e) (n = 3, biologically independent samples). g The mRNA expression patterns of designated genes for islet hormones and selected transcription factors (CHGA, INS, GCG, SST, PPY, ARX, and PDX1) as measured by quantitative PCR analysis (n = 3, biologically independent samples). P values by unpaired two-tailed t-test were *P < 0.05, **P < 0.01, ***P < 0.001, ****P < 0.0001. h Representative IF images from three independent experiments at the α-cell stage depicting GCG, INS and ARX and PDX1, SST and NKX6.1 in d26 α-cells from MAFB+/+ and −/− differentiations. Scale bars, 50 μm. i Quantification of total GCG content from MAFB+/+ and −/− cells at d26–34 in vitro (n = 3, biologically independent samples). P values by paired two-tailed t-test.

