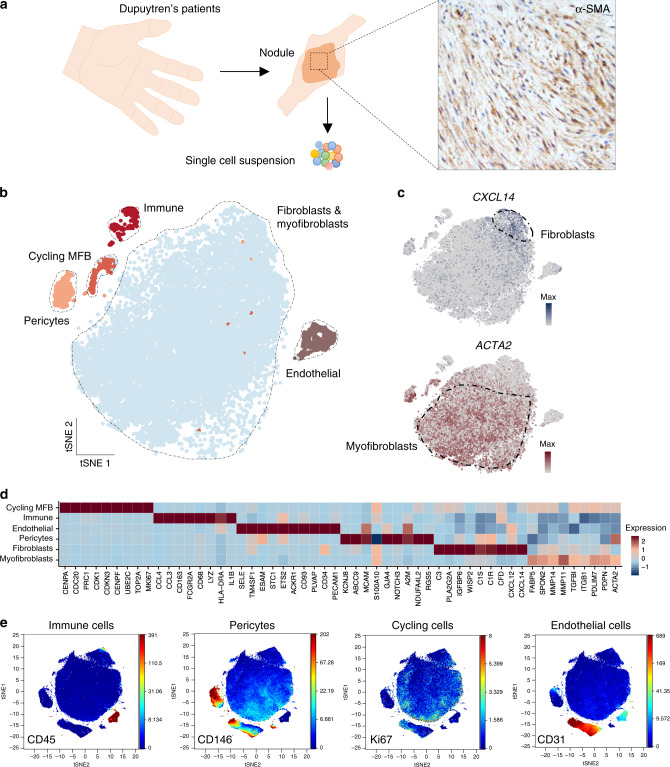
Fig. 1. Single-cell profiling of developing human fibrosis.
a Schematic illustrating experimental protocol for single-cell profiling of Dupuytren’s nodules with representative immunohistochemistry image showing α-SMA protein expression in nodules. b, c tSNE projections of single cell RNA-seq for 36,864 cells from the first batch (n = 6 DD patients) showing major cell types (a) and fibroblasts (CXCL14 expression) and myofibroblasts (ACTA2 expression) (b) in Dupuytren’s nodules. Scale bar in scaled log(UMI + 1). Cycling MFB represents cycling myofibroblasts. d Heatmap of single cell RNA-seq showing z-score normalised mean expression of cell type marker genes in nodular cells. (n = 12 DD patients). e tSNE projections of CyTOF analysis from representative Dupuytren’s nodule, coloured by normalised protein expression of cell type markers (n = 6 DD patients).

