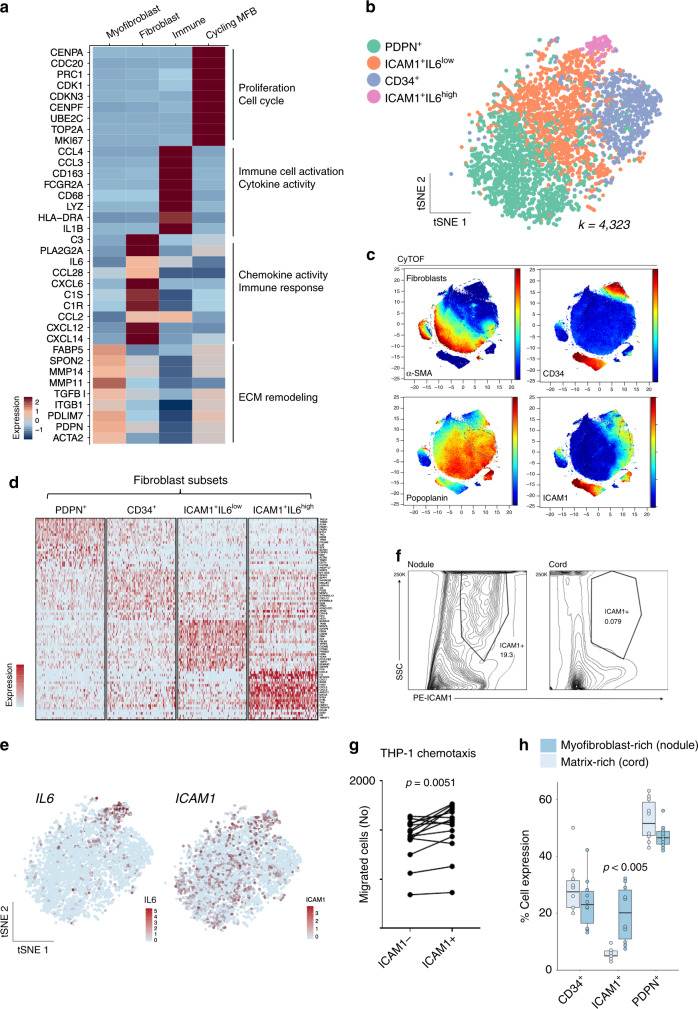
Fig. 2. A dynamic and immunoregulatory ICAM1+ fibroblast in fibrosis.
a Heatmap of single cell RNA-seq showing z-score mean expression of genes driving GO signatures in cell types with exemplar GO terms annotated. GO analysis performed on significant cell type markers (two-sided Wilcoxon Rank sum Test, FDR correction, p-adjust < 0.01). b tSNE projection of fibroblasts coloured by major subsets (n = 12 DD patients) in single cell RNA-seq. c tSNE projections of CyTOF analysis for representative DD nodule showing three major fibroblasts subsets (n = 6 DD patients). Scale bar represents normalised protein expression. d Heatmap of single cell RNA-seq showing mean z-score expression of top 10 marker genes for each fibroblast subset (n = 12 DD patients). e tSNE projections of single cell RNA-seq showing fibroblasts coloured by ICAM1 and IL6 expression in scaled (log(UMI + 1) (n = DD 12 patients). f Representative density plots of flow cytometry analysis showing ICAM1+ fibroblast in freshly isolated cells from matched DD nodule and cord (n = 8 DD patients). g Dot plot of chemotaxis assay showing migration of THP-1 cells after incubation with ICAM1−/+ sorted populations (n = 11 DD patients). Two-sided paired t test, p value = 0.0051. h Box and whisker plots of flow cytometry analysis showing the percentage of cells (proportion) for fibroblast subsets (CD34+, ICAM1+ and PDPN+) in Dupuytren’s nodules and cords as a proportion of total fibroblasts. Two-sided unpaired t test, mean ± SEM (n = 8 DD patients). ICAM1 range 3–32%, median 8% and box bounds 5–17%. CD34 range 13–50%, median 25% and box bounds 22–30%. PDPN range 42–63%, median 48% and box bounds 45–55%. Box bounds are first and third quantiles.

