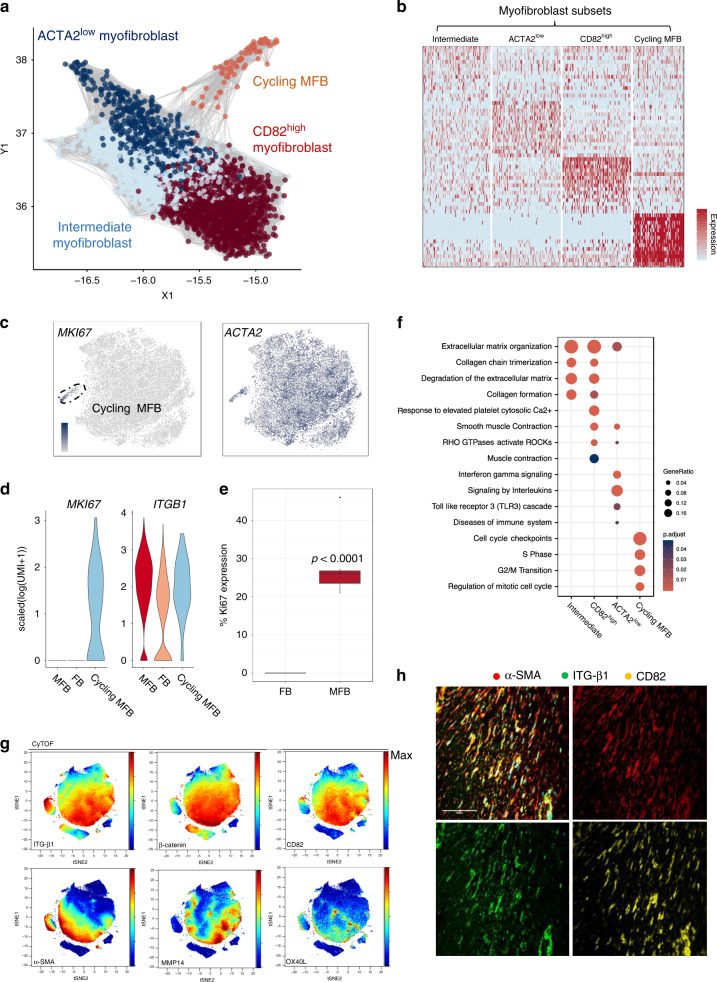
Fig. 3. Distinct myofibroblast states along an activation continuum.
a Force directed graph (Fruchterman–Reingold layout) of single-cell RNA-seq showing myofibroblasts coloured by major subsets (n = 12 DD patients). MFB represents myofibroblast. b Heatmap of single cell RNA-seq showing the z-score expression of top ten myofibroblast subset markers. Two-sided Wilcoxon Rank Sum Test with FDR correction (BH correction (n = 12 DD patients). c tSNE projections of single cell RNA-seq showing myofibroblasts coloured by the expression of ACTA2 and MKI67 in scaled log(UMI + 1) (n = 12 DD patients). d Violin plots showing gene expression of MKI67 and ITGB1 in fibroblasts and myofibroblasts in scaled(log(UMI + 1)) from single cell RNA-seq. e Box and whisker plot of flow cytometry analysis showing Ki67 protein expression in myofibroblasts ITGβ1high myofibroblasts (range 21–46%, mean 28% and box bounds 24–27% representing first to third quantiles) and ITGβ1low fibroblasts (range 0–0%, mean 0.0% and percentiles 0%). Two-sided unpaired t test, p value = 0.00014, mean ± SEM. (n = 8 DD patients). f Dot plot of single cell RNA-seq showing pathways enriched in myofibroblast subsets. Gene ratio is number of marker genes associated with pathway and p.adjust is adjusted p value (two-sided Wilicoxon Rank Sum test, BH FDR-correction). g tSNE projections of CyTOF analysis for representative DD patient showing distinct CD82highOX40L+ myofibroblast. Scale bar is normalised protein expression. (n = 6 DD patients). h Confocal images of immunofluorescence showing co-expression of CD82, α-SMA and ITG-β1 in DD nodules (n = 3 DD patients). Scale bar 20 µm.

