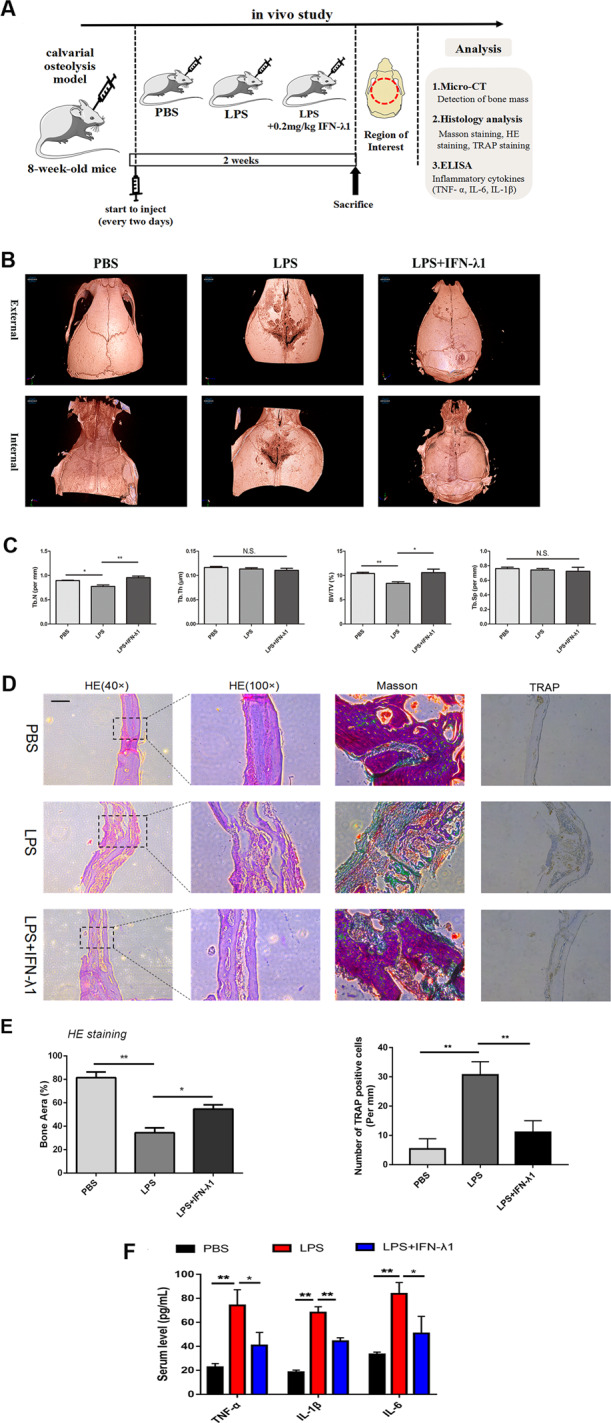
Fig. 2. Exogenous IFN-λ1 inhibited LPS-induced inflammatory osteolysis.

a Schematic representation of the design of in vivo experiments. b Representative 3D μCT images of reconstructed mouse calvarial (from internal to external/from external to internal). c Quantification of trabecular number (Tb. N), trabecular separation (Tb. Sp), trabecular thickness (Tb.Th), and trabecular bone volume fraction (BV/TV). d Representative images of cranial sections stained with H&E, Masson, and TRAP from each group. Scale bars=200μm. e Quantification of percentage of bone area in the border zone of the cranial H&E staining by using Image J software and the analysis of TRAP-positive cells in each group. f ELISA to detect the concentration of IL-1β, IL-6, and TNF-α in serum. The data in the figures represent the averages±SD. N.S. represented as no significant difference. Significant differences are indicated as *p<0.05 or **p<0.01 paired using Student’s t-test unless otherwise specified.
