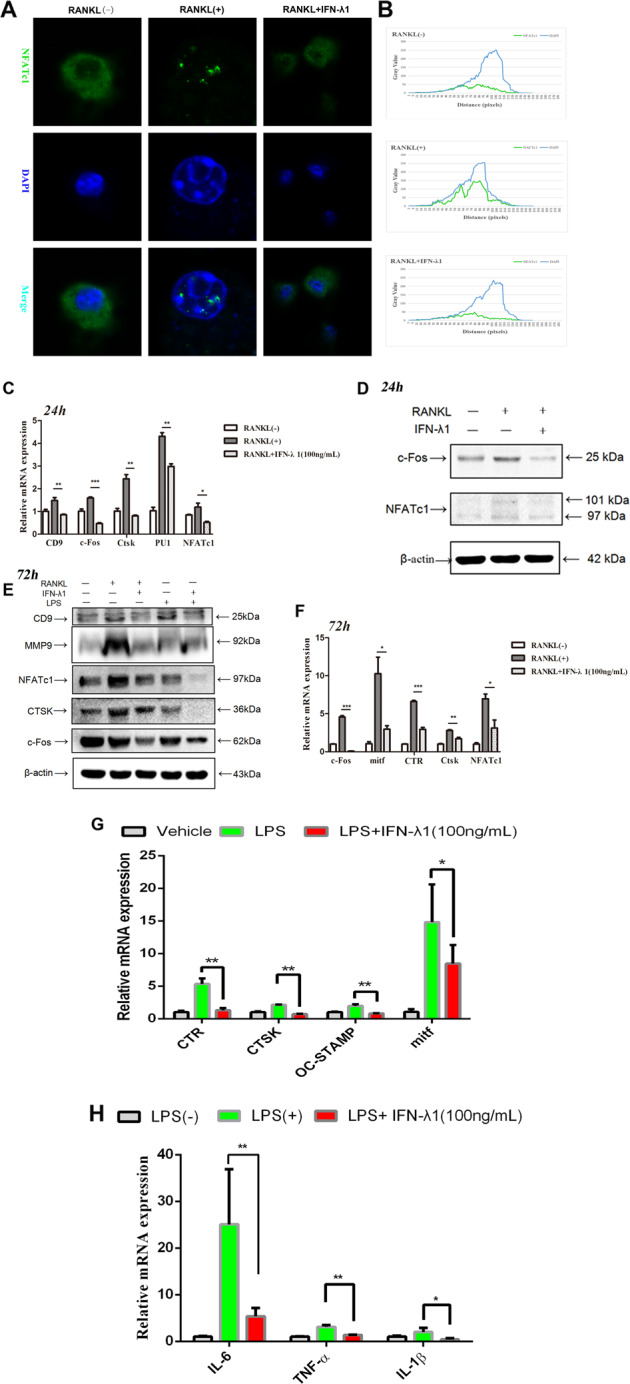
Fig. 6. IFN-λ1 inhibited the nuclei translocation of NFATc1 and the expression of osteoclast-specific genes.

a RAW264.7 cells were seeded in 96-well plates and treated with IFN-λ1 (100 ng/ml) for 24 h, followed by stimulation with 100 ng/ml RANKL and 50 ng/ml M-CSF. The intracellular location of the NFATc1 was observed by immunofluorescence staining using confocal microscopy. Scale bar = 800 μm. b The gray values of the Green and Blue staining were measured using the Image J software, and the mean values were plotted using excel. c Relative mRNA expression of CD9, c-Fos, Ctsk, PU.1, and NFATc1 during treatment with RANKL in the presence or absence of IFN-λ1 (100 ng/ml) for 24 h. d Relative expression of c-Fos and NFATc1 during treatment with RANKL in the presence or absence of IFN-λ1 (100 ng/ml) for 24 h in protein level. β-actin was used as an internal control. e Relative expression of CD9, MMP-9, CTSK, c-Fos, and NFATc1 during treatment with RANKL or LPS in the presence or absence of IFN-λ1 (100 ng/ml) for 72 h in protein level. β-actin was used as an internal control. f Relative mRNA expression of mitf, c-Fos, Ctsk, CTR, and NFATc1 during treatment with RANKL in the presence or absence of IFN-λ1 (100 ng/ml) for 72 h. g Relative mRNA expression of mitf, Ctsk, CTR, and OC-STAMP during treatment with LPS in the presence or absence of IFN-λ1 (100 ng/ml) for 72 h. h Relative mRNA expression of IL-1β, IL-6, and TNF-α during LPS-induced osteoclastogenesis in the presence or absence of IFN-λ1 (100 ng/ml). The data in the figures represent the averages ± SD. Significant differences are indicated as *p < 0.05 or **p < 0.01 paired using Student’s t-test unless otherwise specified.
