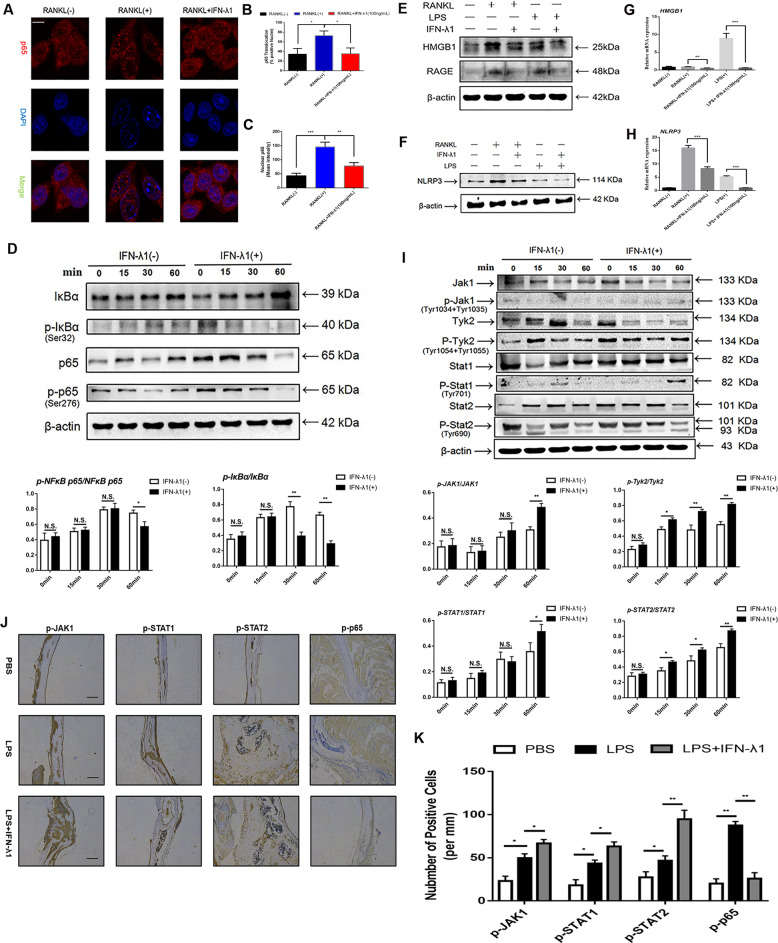
Fig. 7. IFN-λ1 inhibited the classical NF-κB signal pathway, the formation of NLRP3 inflammasome and activated JAK-Stat signal pathway.
a RAW264.7 cells were seeded in 96-well plates and treated with IFN-λ1 (100 ng/ml) for 60 min, followed by stimulation with 100 ng/ml RANKL and 50 ng/ml M-CSF. The intracellular location of the NF-κB p65 was observed by immunofluorescence staining using confocal microscopy. Scale bar = 800 μm. b Quantitative analysis of the percentage of positive cells (NF-ĸB p65 translocation from cytosol to nuclear) in all cells. c Quantitative analysis of the mean intensity of NF-ĸB p65 in the cells nuclear. d RAW264.7 cells were stimulated with RANKL with or without IFN-λ1 (100 ng/ml) for the 0–60 min. The cell lysates were analyzed using western blotting for p-NFκB p65, NF-κB p65, p-IκBα, and IκBα. β-actin was used as an internal control. e, f The expression of HMGB1, RAGE, and NLRP3 during osteoclastogenesis in the presence or absence of IFN-λ1 (100 ng/ml) on protein level. β-actin was used as an internal control. g, h Relative expression of HMGB1 and NLRP3 during osteoclastogenesis in the presence or absence of IFN-λ1 (100 ng/ml) on mRNA level. i RAW264.7 cells were stimulated with RANKL with or without IFN-λ1 (100 ng/ml) for the 0–60 min. The cell lysates were analyzed using western blotting for p-Jak1, Jak1, p-Tyk2, Tyk2, p-Stat1, Stat1, p-Stat2, and Stat2. β-actin was used as an internal control. j Representative images of immunohistochemical staining with monoclonal antibodies against p-p65, p-JAK1, p-STAT1, and p-STAT2. Scale bar = 200 μm. k Quantitative analysis of p-p65, p-JAK1, p-STAT1, and p-STAT2-positive cells per mm in each field. The data in the figures represent the averages ± SD. Significant differences are indicated as *p < 0.05 or **p < 0.01 paired using Student’s t-test unless otherwise specified.

