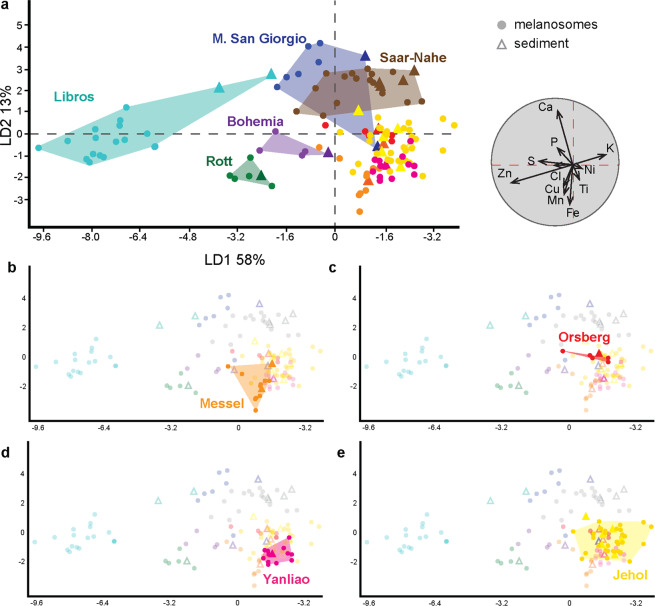
Figure 2.
Linear Discriminant Analysis (LDA) of inorganic chemistry data for fossil melanosomes and sedimentary matrices. (a) Scatterplot of the LDA chemospace for the entire dataset with biplot (grey circle). Biplots show the most discriminating variables, i.e. those that contribute most to the separation among groups. (b–e) Panels highlighting the data for the Messel (b), Orsberg (c), Yanliao (d) and Jehol (e) biotas in the LDA plot in (a).

