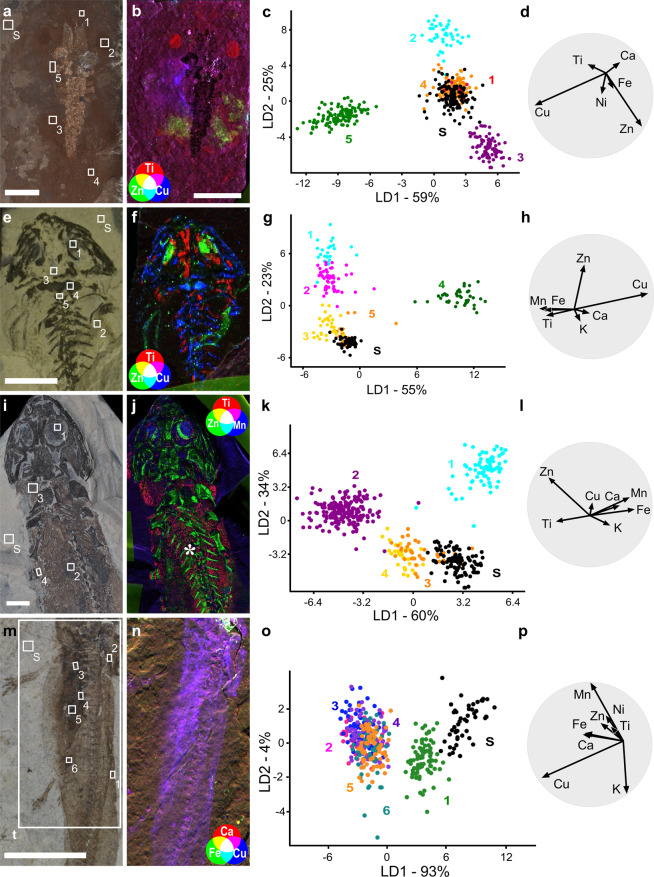
Figure 3.
SRS-XRF and LDA analysis of individual fossil specimens. (a–d) P. diluvianus (NHML-30271); (e–h) B. amplystomus (NHMD-155208); (i–l) M. credneri (NHMB-MB-Am.-1187). (m–p); Amphibia indet. (CNU-SAL-NN2013002P); (b,f,j,n) SRS-XRF tricolor maps of each specimen; maps created using SMAK 1.50 https://www.sams-xrays.com/smak. Asterisks (*) denote internal tissues. (c,g,k,o) LDA plot for each specimen; colours and numbers denote different regions of interest; S, sediment. (d,h,l,p) biplots showing the most discriminating variables, i.e. those that contribute most to the separation among groups.

