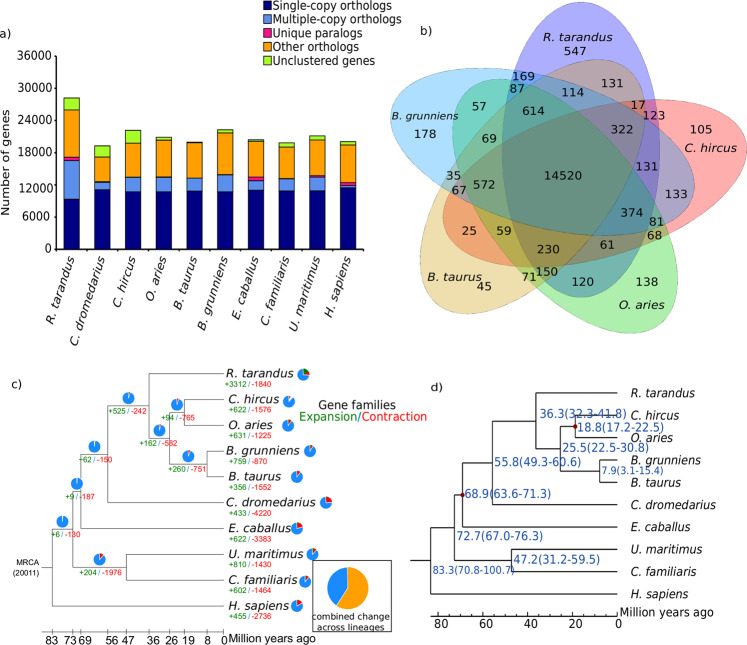
Figure 1.
Gene ontology comparison among genomes of reindeer and nine mammalian species. (a) Distribution of gene clusters among the compared mammalian species. (b) Venn diagram showing unique and shared gene families among five ruminants (cattle, goat, reindeer, sheep and yak). (c) Gene expansion and contraction in the reindeer genome. The numbers of gene families that have expanded (green, +) and contracted (red, -) after splitting are shown on the corresponding branch and pie charts. MRCA, most recent common ancestor. (d) Phylogenetic tree based on 4-fold degenerate sites of 7,951 single-copy orthologous genes. Estimates of divergence time with 95% confidence interval (CI) are shown at each node.

