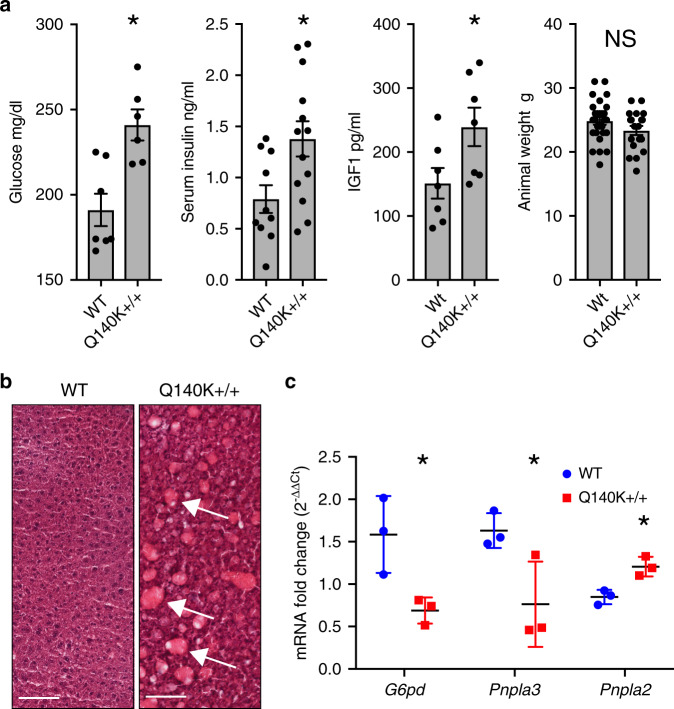
Fig. 4. Male Q140K+/+ mice are hyperglycemic and develop fatty livers.
a Serum levels of glucose (WT n = 7; Q140K+/+ n = 6; p = 0.003), insulin (WT n = 10; Q140K+/+ n = 13; p = 0.018), insulin-like growth factor 1 (IGF1) (WT n = 7; Q140K+/+ n = 7; p = 0.041), and male animal mass (WT n = 28; Q140K+/+ n = 19; p = 0.15) (all ± SEM). b H and E stained representative liver samples from WT and Q140K+/+ male mice; fatty deposits indicated with white arrows (representative of six independent experiments; n = 6 WT and n = 6 Q140K+/+ livers; scale bar 200 µM). c Quantitative real-time PCR analysis of total liver mRNA from WT and fatty Q140K+/+ livers (n = 3 for each) show significant differences in mRNA from genes associated with fatty liver disease; G6pd (p = 0.032), Pnpla3 (p = 0.050), and Pnpla2 (p = 0.012) (±SEM). Statistical analysis: a, c two-tailed Student’s t-test. Source data are provided as a Source data file.

