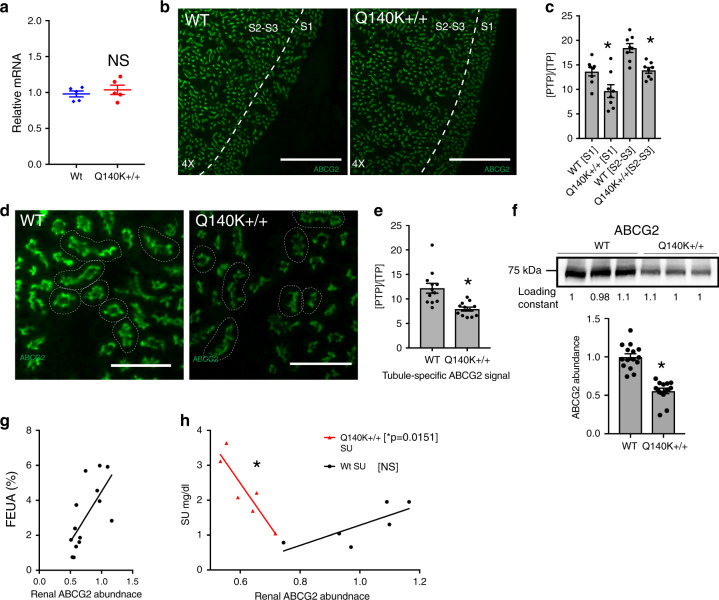
Fig. 5. Subtle alterations of ABCG2 abundance and localization in Q140K+/+ mouse kidney.
a Quantitative real-time PCR analysis of total kidney mRNA shows no significant difference in the mRNA of ABCG2 in WT as compared to Q140K+/+ (n = 5 for both, p = 0.4848; ± SEM). b Representative (similar staining was repeated on tissue from n = 3 mice of each genotype) micrographs (scale bar 500 μM) from fixed whole mouse kidney slices stained with ABCG2 (green). c Quantification of immunofluorescence ABCG2 signal in either S1 or the S2–S3 segments of WT and Q140K+/+ show significant differences (metric = positive thresholded pixels / total pixels [PTP/TP], see “Methods” section), S1: p = 0.02; n = 8 analysis areas from kidney sections from 3 WT animals and 3 Q140K+/+ animals; S2–S3: p = 0.0008; n = 8 analysis areas from kidney sections from 3 WT animals and 3 Q140K+/+ ; ±SEM. d Representative micrographs (scale bar 100 μM) at higher magnification to visualize individual tubules, stained with ABCG2 (green). e Quantification of immunofluorescent ABCG2 signal in individual tubules from WT and Q140K+/+ mice show tubule specific significant differences in [PTP/TP] (p = 0.0007; n = 12 analysis areas from kidney sections of 3 animals of both genotypes; ±SEM). f Western blots of total kidney homogenate from WT (n = 15) and Q140K+/+ (n = 14) male mice showed a significant decrease in abundance of the Q140K+/+ protein (p < 0.0001; loading constant determined by total lane protein analysis [methods]; ±SEM). g FEUA showed a significant correlation (Pearson test statistic, p ≤ 0.0033) and dependence (linear regression, p = 0.0066) on renal ABCG2 abundance (both WT and Q140K+/+). h Plotted dependence of SU on renal abundance of ABCG2 (WT n = 6; Q140K+/+ n = 6) with linear regression fits (WT no different than zero, p = 0.07; SU is significantly dependent on renal ABCG2 abundance in Q140K+/+ animals; p = 0.0151, r2 = 0.8064). Statistical analysis: a, c two-tailed Student’s t-test. Source data are provided as a Source data file.

