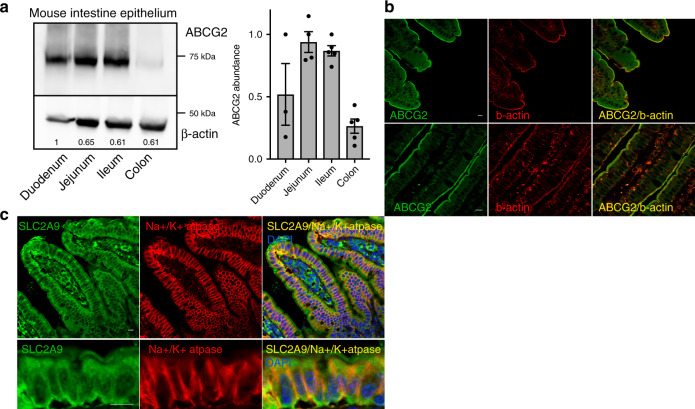
Fig. 6. Localization of ABCG2 in mouse intestine epithelium.
a Representative western blot of homogenized dissected intestinal segments from WT mice (duodenum n = 3; jejunum n = 4; ileum and colon n = 5) showed greatest ABCG2 abundance in the small intestine jejunum and ileum segments; beta-actin used as loading control; summary data of ABCG2 abundance. b Representative immunofluorescence micrographs of fixed sections of mouse small intestines stained for ABCG2 (green), villi brush border marker beta-actin (red), and colocalization of ABCG2 and beta-actin (yellow) at 200× (all scale bars 10 μM) and 400x or c stained for SLC2A9 (green), Na+/K+ ATPase (red), DAPI (blue), and colocalization of SLC2A9 and Na+/K+ ATPase (yellow) 400×, with Z projections (all scale bars 10 μM) (b, c representative images of sections from n = 4 mice). Source data are provided as a Source data file.

