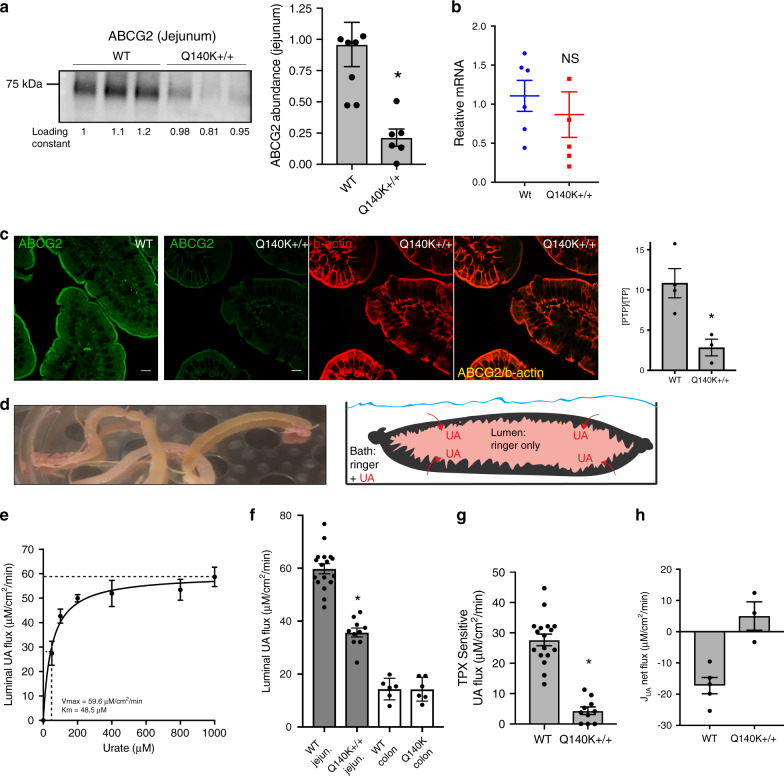
Fig. 7. Severe loss of urate secretion in the intestines of Q140K+/+ mice.
a Western blots of jejunum homogenate from WT (n = 8) and Q140K+/+ (n = 6) mice showed a significant 78% decrease in abundance of the Q140K+/+ protein (p = 0.0046; loading constant determined by total lane protein analysis; ±SEM). b Quantitative real-time PCR analysis of small intestine mRNA shows no significant difference in the mRNA of ABCG2 in WT as compared to Q140K+/+ (n = 5 for both, p = 0.5132; ±SEM). c Representative immunofluorescence micrographs of fixed sections of mouse small intestines (from n = 3 WT and n = 3 Q140K+/+ mice) stained for ABCG2 (green), villi brush border marker beta-actin (red), and colocalization of ABCG2 and beta-actin (yellow) at 200×(all scale bars 10 μM); quantification of immunofluorescent ABCG2 signal in either WT and Q140K+/+ jejunum show significant differences in [PTP/TP] (p = 0.018; n = 4 analysis areas from jejunum sections from 4 WT animals and n = 3 analysis areas from 3 Q140K+/+ animals; ±SEM). d Image of intestinal loops prepared from mouse small intestines; and graphic demonstrating the functional lumen urate accumulation assay. e Plot of urate concentration versus luminal UA flux fit successfully with a Michaelis–Menten curve, Vmax = 59.58 ± 2.74 μM/cm2/min; Km = 48.45 ± 11.44μM, n = 5 animals for each of seven urate concentrations; ±SEM. f Mean luminal flux in WT (n = 17) and Q140K+/+ (n = 10) jejunum loops were significantly different (p < 0.0001); and in colonic loops (n = 6 for both; p = 0.974). g Modeled ABCG2 mediated flux (mean ABCG2 inhibitor TPX sensitive flux subtracted, see “Methods” section) demonstrate almost complete loss in Q140K+/+ animals (reduced 84.2%; WT n = 17 and Q140K+/+ n = 10, p < 0.0001; ±SEM). h Calculated jejunum urate net transport (see “Methods” section) shifts from net luminal secretion to net absorption in the Q140K+/+ loops (WT n = 5; Q140K+/+ n = 3; p = 0.0036; ±SEM). Statistical analysis: a–c, f–h, two-tailed Student’s t-test. Source data are provided as a Source data file.

