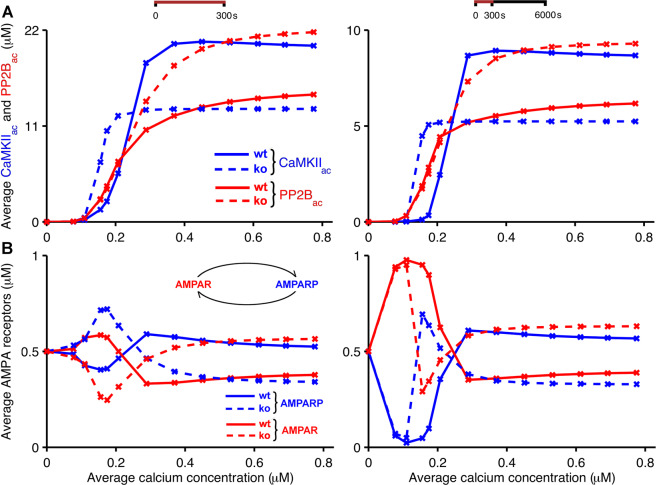
Figure 4.
Bidirectional plasticity at PF-PC synapses: kinase and phosphatase activities at different calcium concentrations. The figure shows simulation results that support the suggested explanation of the experimental observations by Van Woerden et al.33 (Fig. 1). Low calcium concentrations that induce LTP in wild-type mice (solid) lead to LTD in Camk2b knockout mice (dashed), and vice versa. In the model, the F-actin binding to CaMKII occurs in wild-type mice, whereas in knockout mice the lack of β CaMKII prevents the binding of CaMKII to F-actin. (A) Average concentrations of CaMKIIac (blue) and PP2Bac (red) as a function of average concentrations of pulsed calcium at 1 Hz for 300 s. (B) Average concentrations of unphosphorylated and phosphorylated AMPA receptors (red and blue, respectively) in response to the same stimulation protocols. In the left panels, all simulations last 300 s, that is, the panel shows average concentrations of CaMKIIac, PP2Bac and AMPA receptors in the presence of calcium signals applied at 1 Hz for 300 s. The right panels show the average concentrations of these compounds during simulations that last 6000 s, that is, continue for 5700 s after the offset of the 300 s stimulation.

