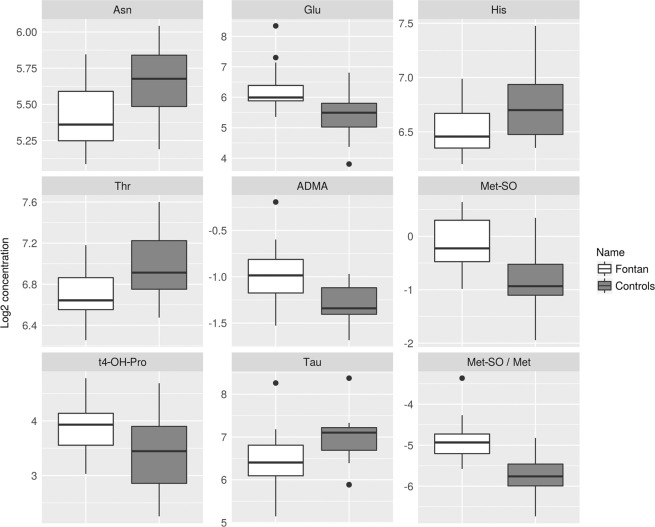
Figure 1.
Box-and-whisker plots of serum concentrations of amino acids or biogenic amines and their ratios that differed significantly between Fontan patients (grey boxes) and controls (white boxes). The boxes show the 1st (Q1) and 3rd quartile (Q3), the whiskers the minimum and the maximum. Black circles represent outlying values as identified by the interquartile range (IQR) rule (values smaller than (Q1-1.5*IQR) or values larger than (Q3 + 1.5*IQR)). ADMA, asymmetric dimethylarginine; Asn, asparagine; Glu, glutamic acid; His, histidine; Met, methionine; Met-SO, methionine sulfoxide; Met-SO/Met, methionine sulfoxide/methionine ratio; t4-OH-Pro, trans-4-hydroxyproline; Tau, taurine; Thr, threonine.

