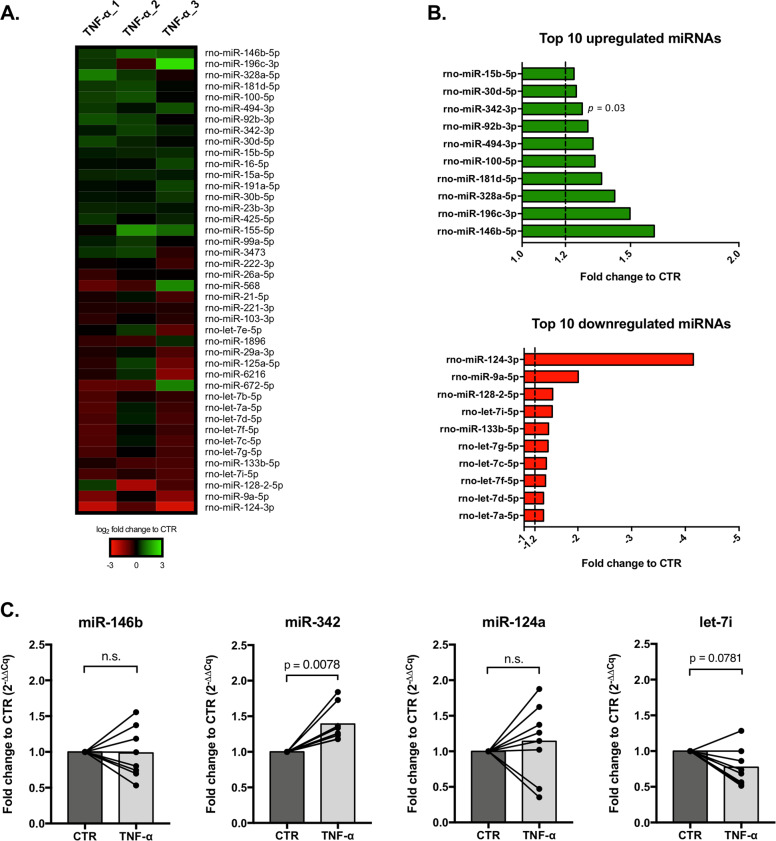
Fig. 2. miR-342 is overexpressed in TNF-α-stimulated microglia.
a Heat map of miRNA microarray expression results in TNF-α activated microglia (n = 3). Only miRNAs with −0.2 ≤ log2 FC to CTR ≥ 0.2 and a detection signal ≥20 are represented. b Ten most upregulated (green) or downregulated (red) miRNAs in TNF-α stimulated microglia (mean FC to CTR, n = 3). c Fold change to control based on the relative expression of the selected miRNAs, evaluated by RT-qPCR (mean, n = 8). U6 SnRNA was used as reference. Cq: quantification cycle. Statistical significance: p < 0.05; Wilcoxon matched-pairs test.

